An open ended equity Scheme following contrarian investment strategy
An open ended equity Scheme following contrarian investment strategy
 |
 |
 
|
|
|
|
| Issuer/Instrument | % to Net Assets |
|
|---|---|---|
| Equity & Equity related | ||
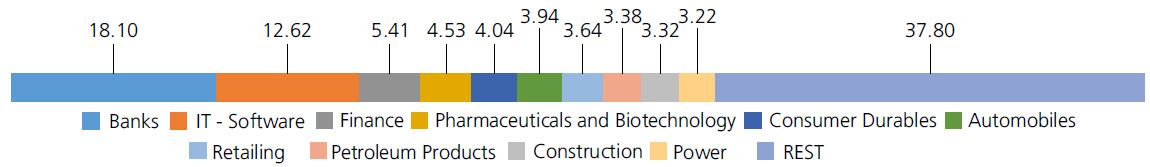
| Banks | 18.10 | |
| ICICI Bank Ltd. | 5.27 | |
| HDFC Bank Ltd. | 3.84 | |
| State Bank Of India | 3.62 | |
| Axis Bank Ltd. | 2.33 | |
| Kotak Mahindra Bank Ltd. | 1.15 | |
| City Union Bank Ltd. | 1.00 | |
| INDIAN BANK | 0.89 | |
| IT - Software | 12.62 | |
| Infosys Ltd. | 4.43 | |
| Tech Mahindra Ltd. | 3.22 | |
| Mphasis Ltd | 3.00 | |
| LTIMindtree Limited | 0.99 | |
| Wipro Ltd. | 0.98 | |
| Finance | 5.41 | |
| Power Finance Corporation Ltd. | 1.77 | |
| Shriram Finance Ltd. | 1.46 | |
| POONAWALLA FINCORP LTD. | 1.32 | |
| LIC Housing Finance Ltd. | 0.86 | |
| Pharmaceuticals and Biotechnology | 4.53 | |
| Sun Pharmaceuticals Industries Ltd. | 1.86 | |
| Torrent Pharmaceuticals Ltd. | 0.99 | |
| Ajanta Pharma Ltd. | 0.94 | |
| JB CHEMICALS & PHARMACEUTICALS LTD. | 0.74 | |
| Consumer Durables | 4.04 | |
| Voltas Ltd. | 1.47 | |
| Kajaria Ceramics Ltd. | 1.14 | |
| Century Plyboards (India) Ltd. | 0.80 | |
| PG ELECTROPLAST LTD | 0.63 | |
| Automobiles | 3.94 | |
| Maruti Suzuki India Limited | 2.18 | |
| Hero MotoCorp Ltd. | 1.76 | |
| Retailing | 3.64 | |
| SWIGGY LTD | 1.57 | |
| Shoppers Stop Ltd. | 1.17 | |
| BRAINBEES SOLUTIONS LIMITED | 0.90 | |
| Petroleum Products | 3.38 | |
| RELIANCE INDUSTRIES LTD. | 2.29 | |
| Bharat Petroleum Corporation Ltd. | 1.09 | |
| Construction | 3.32 | |
| KALPATARU PROJECTS INTERNATIONAL LIMITED | 1.45 | |
| Larsen And Toubro Ltd. | 1.12 | |
| G R Infraprojects Limited | 0.75 | |
| Power | 3.22 | |
| NTPC LTD | 1.55 | |
| Power Grid Corporation Of India Ltd. | 1.05 | |
| NTPC GREEN ENERGY LIMITED | 0.62 | |
| Aerospace and Defense | 3.03 | |
| Bharat Electronics Ltd. | 1.32 | |
| ASTRA MICROWAVE PRODUCTS LTD. | 0.86 | |
| ZEN TECHNOLOGIES LTD | 0.85 | |
| Capital Markets | 2.75 | |
| Aditya Birla Sun Life AMC Ltd | 1.71 | |
| NUVAMA WEALTH MANAGEMENT LIMITED | 1.04 | |
| Diversified FMCG | 2.71 | |
| Hindustan Unilever Ltd. | 1.37 | |
| ITC Ltd. | 1.34 | |
| Telecom - Services | 2.68 | |
| Bharti Airtel Ltd | 2.68 | |
| Entertainment | 2.50 | |
| PVR INOX LIMITED | 1.37 | |
| Sun TV Network Ltd. | 1.13 | |
| Healthcare Services | 2.26 | |
| Fortis Healthcare India Ltd | 1.58 | |
| Metropolis Healthcare Ltd. | 0.68 | |
| Personal Products | 1.95 | |
| Emami Ltd. | 1.04 | |
| Godrej Consumer Products Ltd. | 0.91 | |
| Gas | 1.87 | |
| GAIL (India) Ltd. | 1.87 | |
| Cement and Cement Products | 1.80 | |
| Ultratech Cement Ltd. | 1.80 | |
| Fertilizers and Agrochemicals | 1.73 | |
| Coromandel International Ltd. | 1.73 | |
| Beverages | 1.55 | |
| Radico Khaitan Ltd. | 1.55 | |
| Auto Components | 1.54 | |
| Exide Industries Ltd | 0.78 | |
| JK TYRE & INDUSTRIES LTD. | 0.76 | |
| Industrial Manufacturing | 1.45 | |
| JYOTI CNC AUTOMATION LTD | 0.89 | |
| JNK INDIA LIMITED | 0.56 | |
| Transport Services | 1.41 | |
| Inter Globe Aviation Ltd | 1.41 | |
| Realty | 1.37 | |
| Oberoi Realty Ltd | 1.37 | |
| Leisure Services | 1.33 | |
| SAPPHIRE FOODS INDIA LTD. | 1.33 | |
| Oil | 1.19 | |
| Oil & Natural Gas Corporation Ltd. | 1.19 | |
| Industrial Products | 0.98 | |
| APL APOLLO TUBES LTD. | 0.98 | |
| Chemicals and Petrochemicals | 0.76 | |
| SRF Ltd. | 0.76 | |
| Ferrous Metals | 0.67 | |
| Jindal Steel & Power Ltd. | 0.67 | |
| Equity & Equity related - Total | 97.73 | |
| Triparty Repo | 2.51 | |
| Net Current Assets/(Liabilities) | -0.24 | |
| Grand Total | 100.00 | |
| | ||
| Monthly SIP of (₹) 10000 | Since Inception | 10 years | 7 years | 5 years | 3 years | 1 year |
| Total amount invested (₹) | 23,40,000 | 12,00,000 | 8,40,000 | 6,00,000 | 3,60,000 | 1,20,000 |
| Total Value as on Dec 31, 2024 (₹) | 1,28,57,976 | 32,11,444 | 18,02,782 | 11,12,269 | 5,22,599 | 1,25,552 |
| Scheme Returns (%) | 15.35 | 18.70 | 21.43 | 24.94 | 25.74 | 8.69 |
| Nifty 500 (TRI) Returns (%) | 14.11 | 16.39 | 18.41 | 20.81 | 19.51 | 6.10 |
| Alpha* | 1.25 | 2.31 | 3.01 | 4.13 | 6.23 | 2.59 |
| Nifty 500 (TRI) (₹)# | 1,10,79,866 | 28,34,714 | 16,19,450 | 10,06,783 | 4,79,478 | 1,23,911 |
| Nifty 100 (TRI) Returns (%) | 13.47 | 14.78 | 16.01 | 17.57 | 15.79 | 2.90 |
| Alpha* | 1.88 | 3.92 | 5.41 | 7.37 | 9.95 | 5.79 |
| Nifty 100 (TRI) (₹)# | 1,02,73,545 | 26,00,318 | 14,86,617 | 9,30,299 | 4,54,960 | 1,21,867 |
| Nifty 50 (TRI) (₹)^ | 97,46,196 | 25,60,790 | 14,61,571 | 9,11,372 | 4,45,453 | 1,21,600 |
| Nifty 50 (TRI) Returns (%) | 13.02 | 14.49 | 15.53 | 16.73 | 14.32 | 2.48 |
| Regular | Direct | |
| Growth | Rs146.0740 | Rs171.0610 |
| IDCW | Rs50.3510 | Rs60.8720 |
A) Regular Plan B) Direct Plan
Options: Payout of IDCW, Reinvestment of
IDCW & Growth (applicable for all plans)
| Fund Manager* | Ms. Shibani Sircar Kurian |
| Benchmark*** | Nifty 500 TRI (Tier 1), Nifty 100 TRI (Tier 2) |
| Allotment date | July 27, 2005 |
| AAUM | Rs4,065.94 crs |
| AUM | Rs3,985.56 crs |
| Folio count | 1,10,521 |
Trustee's Discretion
| Portfolio Turnover | 42.77% |
| $Beta | 0.96 |
| $Sharpe ## | 0.96 |
| $Standard Deviation | 13.40% |
| ^^(P/E) | 22.45 |
| ^^P/BV | 3.44 |
Initial & Additional Investment
• Rs100 and any amount thereafter
Systematic Investment Plan (SIP)
• Rs 100 and any amount thereafter
• 5 years & above
Entry Load:
Nil. (applicable for all plans)
Exit Load:
• For redemption / switch out within 90
days from the date of allotment:1%
• If units are redeemed or switched out on
or after 90 days from the date of allotment -
Nil.
| Regular Plan: | 1.87% |
| Direct Plan: | 0.56% |
Folio Count data as on 30th November 2024.
Benchmark - Tier 1 : Nifty 500 TRI
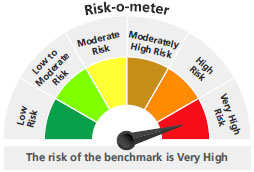
Benchmark - Tier 2 : Nifty 100 TRI
This product is suitable for investors who are seeking*:
- Long term capital growth
- Investment in portfolio of predominantly equity & equity related securities.
* Investors should consult their financial advisors if in doubt about whether the product is suitable for them.
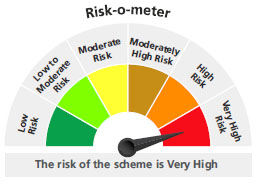
The above risk-o—meter is based on the scheme portfolio as on 30th November, 2024. An addendum may be issued or updated on the website for new riskometer.
## Risk rate assumed to be 7.15% (FBIL Overnight MIBOR rate as on 31st Dec 2024).**Total Expense Ratio includes applicable B30 fee and GST.
* For Fund Manager experience, please refer 'For Regular Plan' & 'For Direct Plan'
For last three IDCW, please refer 'Dividend History'.
For scheme performance, please refer 'For Regular Plan' & 'For Direct Plan'