 
|
|
|
Key Events for the Month of December 2024
• India’s Services Purchasing Managers' Index (PMI) for December 2024 rose to 59.3 points, an increase from 58.4 points
recorded in November 2024, signaling growth in the country’s services sector.
• The manufacturing activity in India registered its weakest growth of 2024 in December as the Manufacturing Purchasing
Managers’ Index (PMI) fell to 56.4, down from 56.5 in November 2024. The data indicated softer demand in the sector
despite easing cost pressures and strong jobs growth.
• In November 2024, India’s year-on-year CPI inflation eased to 5.48%, down from 6.21% in October. The decline was
primarily driven by improved vegetable supply, which moderated food prices.
• India’s Wholesale Price Index (WPI) inflation fell to 1.89% year-on-year in November 2024, from 2.36% in October,
primarily due to a slowdown in food price increases.
• GST revenue stood at ₹1.77 lakh crore, reflecting a 7.3% increase from December 2023. However, this represents a
sequential decline from November, suggesting post-festive season normalization.
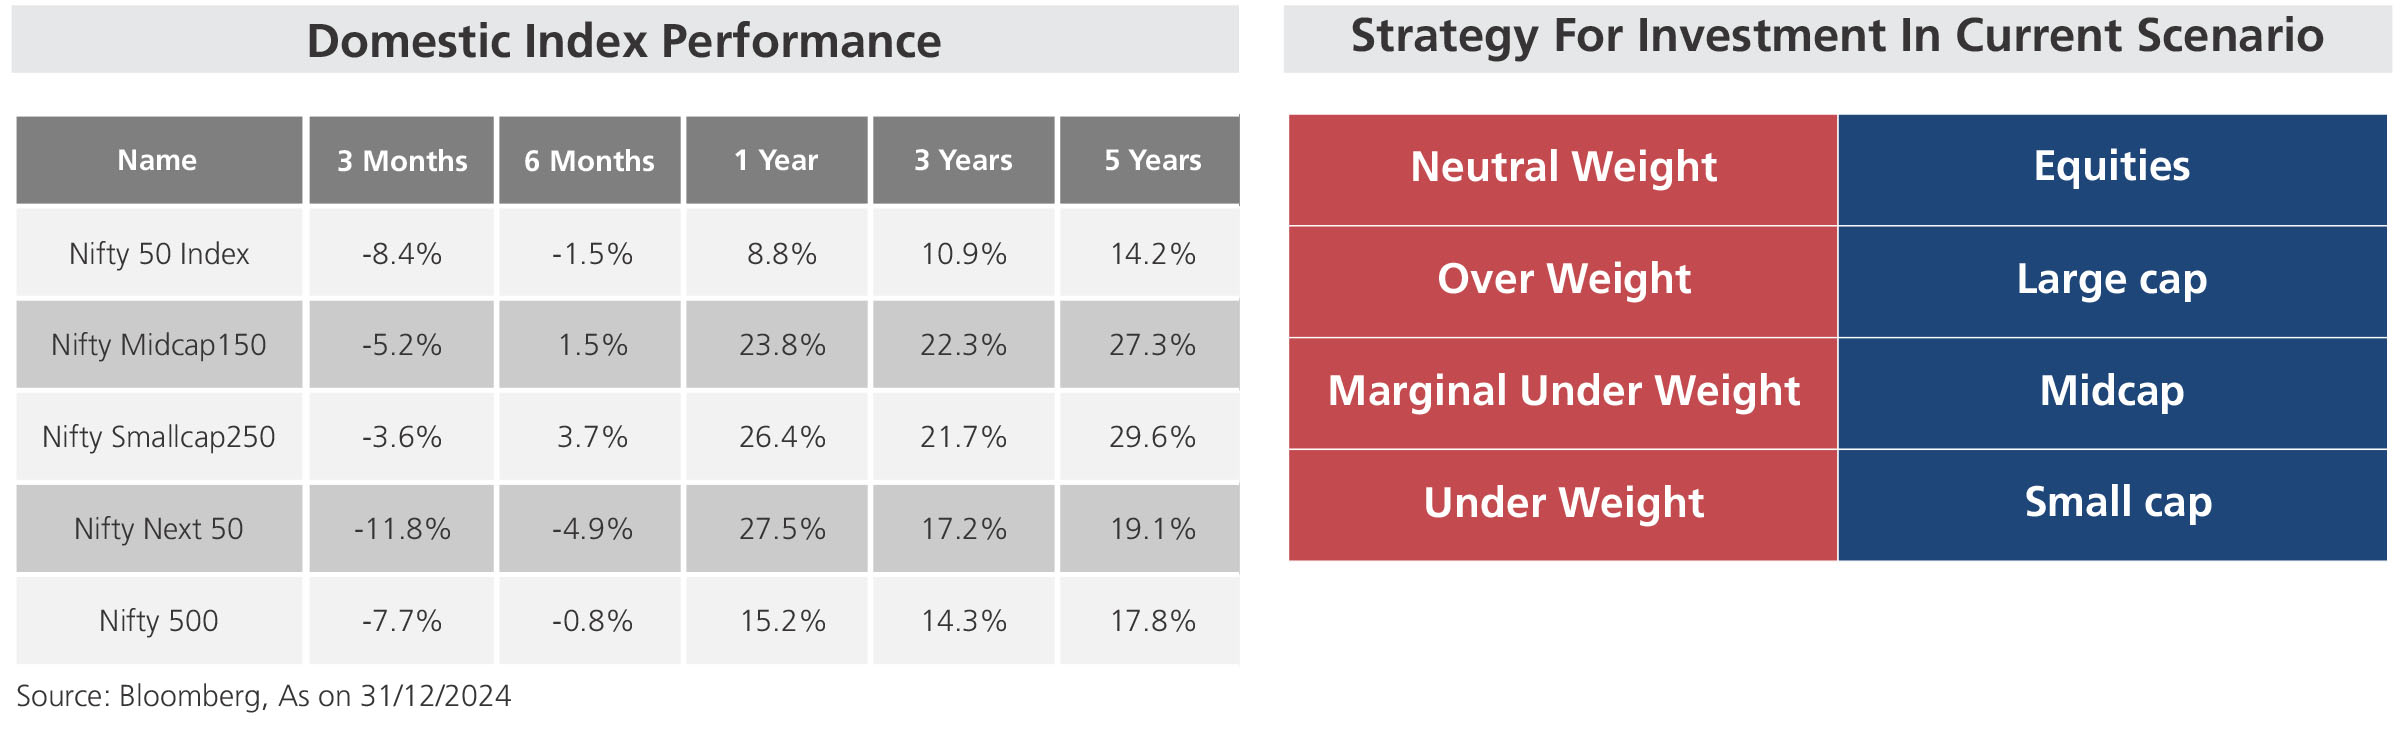
• The Sensex delivered a 1-year return of 8.17%, while the Nifty achieved a 1-year return of 8.80%, showcasing
consistent performance by key market indices over the period.
| |
Sectoral Index Performance |
| Name | 3 Months | 6 Months | 1 Year | 3 Years | 5 Years |
| Nifty Auto Index | -15.5% | -9.4% | 22.6% | 27.8% | 22.6% |
| Nifty Bank Index | -4.0% | -2.8% | 5.3% | 12.7% | 9.6% |
| Nifty Energy Index | -20.1% | -15.8% | 5.1% | 15.8% | 17.2% |
| Nifty Financial Services Index | -4.0% | 0.4% | 9.4% | 10.7% | 10.1% |
| Nifty FMCG Index | -13.3% | 0.1% | -0.3% | 14.7% | 13.5% |
| Nifty Healthcare Index | 1.4% | 18.9% | 40.6% | 18.6% | 25.3% |
| Nifty Infrastructure Index | -11.6% | -7.3% | 15.9% | 19.6% | 21.0% |
| Nifty IT Index | 3.3% | 19.9% | 22.0% | 3.8% | 22.6% |
| Nifty Media Index | -15.0% | -8.8% | -23.9% | -6.4% | 0.2% |
| Nifty Metal Index | -15.2% | -11.9% | 8.4% | 16.1% | 25.3% |
| Nifty Pharma Index | 0.6% | 18.7% | 39.1% | 18.1% | 23.8% |
| Nifty Psu Bank Index | -3.2% | -11.2% | 14.5% | 37.2% | 20.9% |
| Nifty Realty Index | -4.2% | -4.7% | 34.4% | 29.5% | 28.6% |
| BSE Consumer Durables Index | -4.8% | 9.5% | 28.9% | 12.9% | 20.8% |
| BSE Industrial Index | -5.8% | -4.8% | 28.4% | 37.5% | 38.5% |
| |
Global Index Performance |
| Name | 3 Months | 6 Months | 1 Year | 3 Years | 5 Years |
| MSCI World | -0.4% | 5.6% | 17.0% | 4.7% | 9.5% |
| MSCI Emerging | -8.1% | -1.0% | 5.1% | -4.4% | -0.7% |
| MSCI India index | -8.9% | -2.0% | 14.3% | 11.8% | 15.7% |
| Dow Jones Industrial Average | 0.5% | 8.8% | 12.9% | 5.4% | 8.3% |
| Nasdaq Composite Index | 6.2% | 8.9% | 28.6% | 7.3% | 16.5% |
| Nikkei 225 | 5.2% | 0.8% | 19.2% | 11.5% | 11.0% |
| Shanghai Composite | 0.5% | 13.0% | 12.7% | -2.7% | 1.9% |
| Deutsche Boerse AG german Stock Index DAX | 3.0% | 9.2% | 18.8% | 7.8% | 8.5% |