An open ended liquid scheme
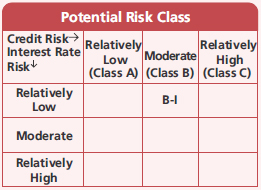
A relatively low interest rate risk and moderate credit risk
An open ended liquid scheme
A relatively low interest rate risk and moderate credit risk
 |
 |
 
|
|
|
|
| Issuer/Instrument | Industry/ Rating |
% to Net Assets |
|---|---|---|
| Debt Instruments | ||
| Debentures and Bonds | ||
| Corporate Debt/Financial Institutions | ||
| Sikka Ports & Terminals Ltd. ( Mukesh Ambani Group ) | CRISIL AAA | 1.41 |
| LIC Housing Finance Ltd. | CRISIL AAA | 0.45 |
| HDFC Ltd. | CRISIL AAA | 0.41 |
| Grasim Industries Ltd. | CRISIL AAA | 0.13 |
| Corporate Debt/Financial Institutions - Total | 2.40 | |
| Public Sector Undertakings | ||
| Power Finance Corporation Ltd. | CRISIL AAA | 0.66 |
| Public Sector Undertakings - Total | 0.66 | |
| Money Market Instruments | ||
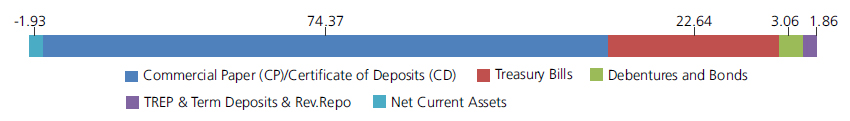
| Commercial Paper(CP)/Certificate of Deposits(CD) | ||
| Corporate Debt/Financial Institutions | ||
| Reliance Industries Ltd. | CRISIL A1+ | 5.28 |
| Reliance Retail Ventures Ltd | CRISIL A1+ | 4.57 |
| Larsen and Toubro Ltd. | CRISIL A1+ | 3.44 |
| Aditya Birla Finance Ltd. | ICRA A1+ | 2.64 |
| Bajaj Finance Ltd. | CRISIL A1+ | 2.59 |
| Axis Bank Ltd. | CRISIL A1+ | 2.04 |
| Tata Steel Ltd. | ICRA A1+ | 1.33 |
| Bajaj Finance Ltd. | ICRA A1+ | 1.32 |
| Indusind Bank Ltd. | CRISIL A1+ | 1.32 |
| Reliance Jio Infocomm Ltd. | CRISIL A1+ | 1.32 |
| Birla Group Holding Private Limited | CRISIL A1+ | 1.31 |
| Can Fin Homes Ltd. | ICRA A1+ | 1.31 |
| IDFC First Bank Limited | CRISIL A1+ | 1.31 |
| Mahindra & Mahindra Financial Services Ltd. | CRISIL A1+ | 1.26 |
| Tata Motors Finance Ltd. | ICRA A1+ | 1.18 |
| ICICI Securities Primary Dealership Ltd. | CRISIL A1+ | 1.05 |
| Bharti Telecom Ltd. | CRISIL A1+ | 0.95 |
| L & T Finance Ltd. | CRISIL A1+ | 0.80 |
| Sikka Ports & Terminals Ltd. | CRISIL A1+ | 0.80 |
| TVS Credit Services limited | CRISIL A1+ | 0.65 |
| Julius Baer Capital (India) Pvt. Ltd | CRISIL A1+ | 0.59 |
| HDFC Securities Limited | CRISIL A1+ | 0.53 |
| Sharekhan Limited | CRISIL A1+ | 0.46 |
| Poonawalla Fincorp Limited | CRISIL A1+ | 0.39 |
| Axis Securities Limited | ICRA A1+ | 0.27 |
| Axis Finance Ltd. | CRISIL A1+ | 0.26 |
| Nirma Ltd. | CRISIL A1+ | 0.26 |
| Tata Capital Financial Services Limited | CRISIL A1+ | 0.26 |
| Hero FinCorp Ltd. | CRISIL A1+ | 0.24 |
| HDFC Bank Ltd. | CARE A1+ | 0.13 |
| HDFC Ltd. | CRISIL A1+ | 0.13 |
| Corporate Debt/Financial Institutions - Total | 39.99 | |
| Public Sector Undertakings | ||
| Canara Bank | CRISIL A1+ | 8.30 |
| Indian Bank | CRISIL A1+ | 6.33 |
| Small Industries Development Bank Of India | CARE A1+ | 5.21 |
| Punjab National Bank | CARE A1+ | 2.76 |
| Punjab National Bank | CRISIL A1+ | 2.65 |
| National Bank for Agriculture & Rural Development | ICRA A1+ | 2.56 |
| National Bank for Agriculture & Rural Development | CRISIL A1+ | 1.42 |
| Bank Of Baroda | FITCH IND A1+ | 1.40 |
| Union Bank of India | CRISIL A1+ | 1.33 |
| Punjab National Bank | ICRA A1+ | 0.92 |
| Small Industries Development Bank Of India | CRISIL A1+ | 0.84 |
| Bank Of Maharashtra | CRISIL A1+ | 0.66 |
| Public Sector Undertakings - Total | 34.38 | |
| Treasury Bills | ||
| 91 DAYS TREASURY BILL 10/08/2023 | SOV | 4.09 |
| 182 DAYS TREASURY BILL 17/08/2023 | SOV | 3.25 |
| 91 DAYS TREASURY BILL 06/07/2023 | SOV | 2.64 |
| 182 DAYS TREASURY BILL 15/06/2023 | SOV | 2.08 |
| 91 DAYS TREASURY BILL 08/06/2023 | SOV | 1.84 |
| 182 DAYS TREASURY BILL 06/07/2023 | SOV | 1.24 |
| 182 DAYS TREASURY BILL 03/08/2023 | SOV | 1.05 |
| 91 DAYS TREASURY BILL 24/08/2023 | SOV | 1.03 |
| 182 DAYS TREASURY BILL 10/08/2023 | SOV | 0.92 |
| 182 DAYS TREASURY BILL 22/06/2023 | SOV | 0.86 |
| 182 DAYS TREASURY BILL 13/07/2023 | SOV | 0.79 |
| 91 DAYS TREASURY BILL 13/07/2023 | SOV | 0.66 |
| 91 DAYS TREASURY BILL 03/08/2023 | SOV | 0.53 |
| 182 DAYS TREASURY BILL 24/08/2023 | SOV | 0.39 |
| 182 DAYS TREASURY BILL 28/07/2023 | SOV | 0.38 |
| 91 DAYS TREASURY BILL 15/06/2023 | SOV | 0.27 |
| 364 DAYS TREASURY BILL 08/06/2023 | SOV | 0.24 |
| 364 DAYS TREASURY BILL 15/06/2023 | SOV | 0.20 |
| 182 DAYS TREASURY BILL 08/06/2023 | SOV | 0.09 |
| 364 DAYS TREASURY BILL 01/06/2023 | SOV | 0.09 |
| Treasury Bills - Total | 22.64 | |
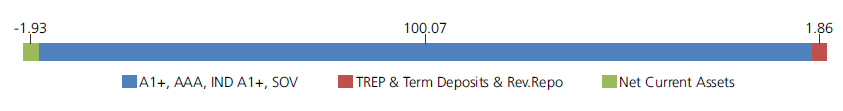
| Triparty Repo | 1.86 | |
| Net Current Assets/(Liabilities) | -1.93 | |
| Grand Total | 100.00 | |
| Growth Option | Rs4569.368 |
| Direct Growth Option | Rs4601.6903 |
| Daily-Reg-Plan-IDCW | Rs1222.81 |
| Daily-Dir-Plan-IDCW | Rs1222.81 |
A) Regular Plan B) Direct Plan
Options: Payout of IDCW, Reinvestment of
IDCW & Growth (applicable for all plans)
| Fund Manager* | Mr. Deepak Agrawal &
Mr. Vihag Mishra (Dedicated fund manager for investments in foreign securities) |
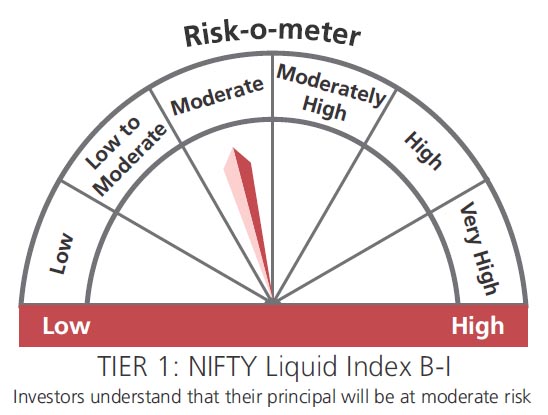
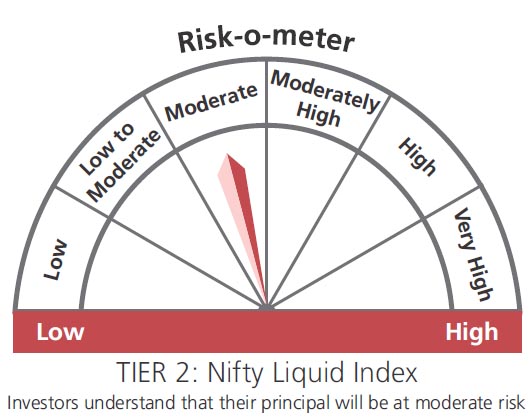
| Benchmark*** | Nifty Liquid Index B-I (Tier 1), Nifty Liquid Index (Tier 2) |
| Allotment date | November 4, 2003 |
| AAUM | Rs33,017.49 crs |
| AUM | Rs36,604.61 crs |
| Folio count | 55,244 |
Daily
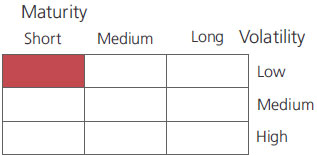
| Portfolio Average Maturity | 0.11 yrs |
| IRS Average Maturity* | - |
| Net Average Maturity | 0.11 yrs |
| Portfolio Modified Duration | 0.11 yrs |
| IRS Modified Duration* | - |
| Net Modified Duration | 0.11 yrs |
| Portfolio Macaulay Duration | 0.11 yrs |
| IRS Macaulay Duration* | - |
| Net Macaulay Duration | 0.11 yrs |
| Annualised YTM* | 6.83% |
| $Standard Deviation | 0.31% |
*Interest Rate Swap
*in case of semi annual YTM, it will be annualized.
Source: $ICRAMFI Explorer. Standard Deviation is calculated on Annualised basis using 3 years history of monthly returns.
Initial Investment:Rs100 and in multiple of Rs1 for
purchases and for Rs0.01 for switches
Additional Investment: Rs100 and in multiples of
Rs1 for purchases and for Rs0.01 for switches
Ideal Investment Horizon: 7 days to month
Entry Load: Nil. (applicable for all plans)
1. Exit load shall applicable be as per the graded basis as specified below:
| Investor exit upon subscription | Exit load as a % of redemption proceeds |
| Day 1 | 0.0070% |
| Day 2 | 0.0065% |
| Day 3 | 0.0060% |
| Day 4 | 0.0055% |
| Day 5 | 0.0050% |
| Day 6 | 0.0045% |
| Day 7 onwards | 0.0000% |
Any exit load charged (net off Goods and Services tax, if any) shall be credited back to the Scheme. Units issued on reinvestment of IDCW shall not be subject to entry and exit load.
Regular: 0.32%; Direct: 0.20%
Fund
Benchmark
Benchmark
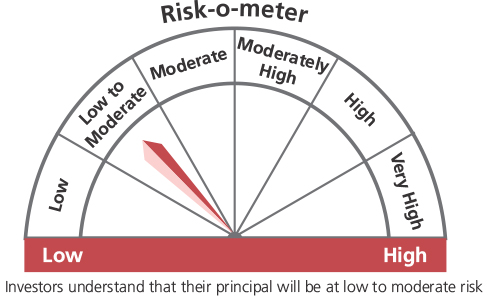
This product is suitable for investors who are seeking*:
- Income over a short term investment horizon
- Investment in debt & money market securities
* Investors should consult their financial advisors if in doubt about whether the product is suitable for them.
The above risk-o—meter is based on the scheme portfolio as on 31st May, 2023. An addendum may be issued or updated on the website for new riskometer.
**Total Expense Ratio includes applicable B30 fee and GST.
***As per SEBI circular no. SEBI/HO/IMD/IMD-11 DF3/P/CIR/2021 /652 dated October 27, 2021; AMFI letter no. 35P/MEM-COR/70/2021-22 dated November 25, 2021 and AMFI letter no. 35P/ MEM-COR/ 131 / 2021-22 dated March 31, 2022 with effect from April 01, 2022 ("Effective date"), the first tier benchmark index of the scheme.
Existing benchmark will be Second Tier benchmark for aforementioned scheme.
* For Fund Manager experience, please refer 'Our Fund Managers'
For scheme performance, please refer 'Scheme Performances'