An open-ended scheme investing in equity, arbitrage and debt
An open-ended scheme investing in equity, arbitrage and debt
 |
 |
 
|
|
|
|
The investment objective of the scheme is to generate capital appreciation and income by predominantly investing in arbitrage opportunities in the cash and derivatives segment of the equity market, and enhance returns with a moderate exposure in equity & equity related instruments. There is no assurance or guarantee that the investment objective of the scheme will be achieved.
The investment objective of the scheme is to generate capital appreciation and income by predominantly investing in arbitrage opportunities in the cash and derivatives segment of the equity market, and enhance returns with a moderate exposure in equity & equity related instruments. There is no assurance or guarantee that the investment objective of the scheme will be achieved.
| Issuer/ Instrument |
Industry/ Rating |
% to Net Assets |
% to Net Assets Derivatives |
| Equity & Equity related
|
|||
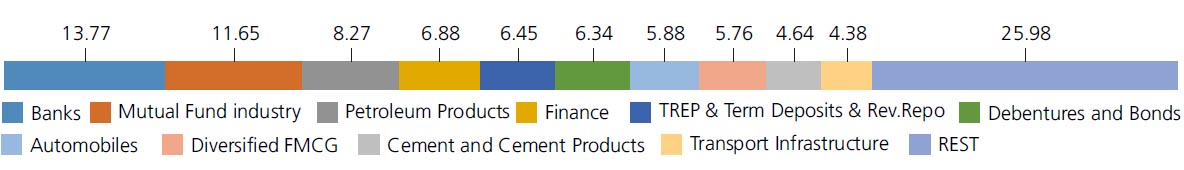
| Reliance Industries Ltd. | Petroleum Products | 5.12 | -5.12 |
| Adani Port and Special Economic Zone Ltd. | Transport Infrastructure | 4.38 | -4.40 |
| ICICI Bank Ltd. | Banks | 3.99 | -3.99 |
| ITC Ltd. | Diversified FMCG | 3.91 | |
| CNX NIFTY-JUN2023 | -3.22 | ||
| Maruti Suzuki India Limited | Automobiles | 2.73 | |
| Ambuja Cements Ltd. | Cement and Cement Products | 2.60 | -2.62 |
| Reliance Industries Ltd. | Petroleum Products | 2.19 | |
| Hero MotoCorp Ltd. | Automobiles | 2.16 | |
| Grasim Industries Ltd. | Cement and Cement Products | 1.99 | -2.00 |
| Others | 38.97 | -15.27 | |
| Equity & Equity related - Total | 68.04 | -36.62 | |
| Mutual Fund Units | 11.65 | ||
| Debt Instruments | |||
| Debentures and Bonds | 6.34 | ||
| Money Market Instruments | 3.80 | ||
| Commercial Paper(CP)/Certificate of Deposits(CD) | 3.94 | ||
| Triparty Repo | 6.45 | ||
| Net Current Assets/(Liabilities) | -0.22 | ||
| Grand Total | 100.00 | ||
For detailed portfolio log on to
https://www.kotakmf.com/Products/funds/hybrid-funds/Kotak-Equity-Savings-Fund/Dir-G
Mutual Fund Units as provided above is towards margin for derivatives transactions
Equity Derivative Exposuer is 36.62%
| Monthly SIP of (₹) 10000 | Since Inception | 7 years | 5 years | 3 years | 1 year |
| Total amount invested (₹) | 10,40,000 | 8,40,000 | 6,00,000 | 3,60,000 | 1,20,000 |
| Total Value as on May 31, 2023 (₹) | 15,32,601 | 11,53,309 | 7,60,272 | 4,15,272 | 1,26,509 |
| Scheme Returns (%) | 8.73 | 8.92 | 9.42 | 9.52 | 10.26 |
| Nifty Equity Savings Index (%) | 8.81 | 8.91 | 9.04 | 8.44 | 9.10 |
| Alpha | -0.08 | 0.00 | 0.38 | 1.08 | 1.16 |
| Nifty Equity Savings Index (₹)# | 15,38,059 | 11,53,151 | 7,53,202 | 4,08,723 | 1,25,784 |
| 75% NIFTY 50 ARBITRAGE + 25% Nifty 50 Returns (%) | 7.16 | 7.22 | 7.38 | 7.42 | 8.30 |
| Alpha | 1.57 | 1.70 | 2.04 | 2.10 | 1.96 |
| 75% NIFTY 50 ARBITRAGE + 25% Nifty 50 (₹)# | 14,28,397 | 10,85,509 | 7,22,630 | 4,02,607 | 1,25,281 |
| CRISIL 10 Year Gilt Index (₹)^ | 13,44,513 | 10,18,678 | 6,85,930 | 3,85,222 | 1,27,225 |
| CRISIL 10 Year Gilt Index (%) | 5.81 | 5.43 | 5.30 | 4.46 | 11.41 |
| Growth option | Rs20.2555 |
| Direct Growth option | Rs21.7323 |
| Monthly-Reg-Plan-IDCW | Rs14.8303 |
| Monthly-Dir-Plan-IDCW | Rs15.6016 |
A) Regular Plan B) Direct Plan
Options: Payout of IDCW, Reinvestment of IDCW & Growth (applicable for all plans)
| Fund Manager* | Mr. Devender Singhal, Mr. Abhishek Bisen, Mr. Hiten Shah & Mr. Arjun Khanna (Dedicated fund manager for investments in foreign securities) |
| Benchmark*** | NIFTY Equity Savings (Tier 1) 75% NIFTY 50 ARBITRAGE, 25% Nifty 50 TRI (Tier 2) |
| Allotment date | October 13, 2014 |
| AAUM | Rs2,254.89 crs |
| AUM | Rs2,368.67 crs |
| Folio count | 21,569 |
Monthly (12th of every month)
| Portfolio Turnover | 494.46% |
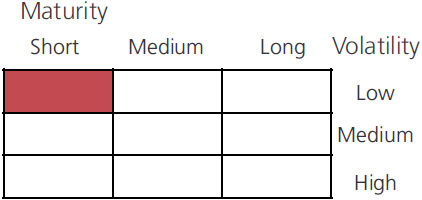
| Portfolio Average Maturity | 3.42 yrs |
| IRS Average Maturity* | - |
| Portfolio Modified Duration | 3.42 yrs |
| Net Average Maturity | 1.27 yrs |
| IRS Modified Duration* | - |
| Net Modified Duration | 1.27 yrs |
| Portfolio Macaulay Duration | 1.35 yrs |
| IRS Macaulay Duration* | - |
| Net Macaulay Duration | 1.35 yrs |
| Annualised YTM* | 7.22% |
| $Beta | 0.73 |
| $Sharpe ## | 1.34 |
| $Standard Deviation | 4.18% |
Initial Investment: Rs5000 and in multiples of
Rs1 for purchases and for Rs0.01 for switches
Additional Investment: Rs1000 & in
multiples of Rs1 for purchases and for Rs0.01
for switches
Ideal Investments Horizon: 3 years & above
Entry Load: Nil.
Exit Load:
a) For redemption / switch out of upto 8%
of the initial investment amount (limit)
purchased or switched in within 90 days
from the date of allotment: Nil.
b) If units redeemed or switched out are in
excess of the limit within 90 days from the
date of allotment: 1%
c) If units are redeemed or switched out
after 90 days from the date of allotment:
NIL
Regular: 2.03%; Direct: 1.01%
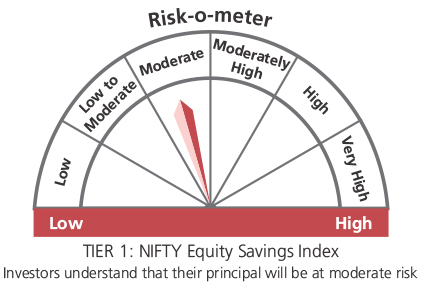
Fund
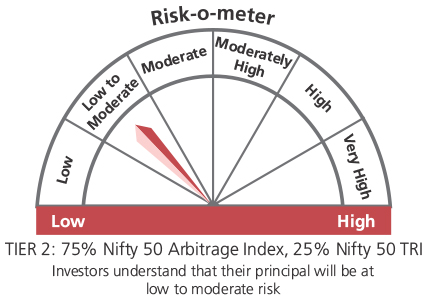
Benchmark
Benchmark
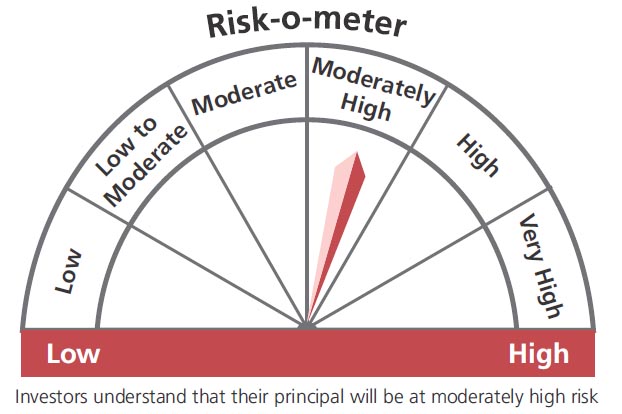
This product is suitable for investors who are seeking*:
- Income from arbitrage opportunities in the equity market & long term capital growth
- Investment predominantly in arbitrage opportunities in the cash & derivatives segment of the equity market and equity & equity related securities
* Investors should consult their financial advisors if in doubt about whether the product is suitable for them.
The above risk-o—meter is based on the scheme portfolio as on 31st May, 2023. An addendum may be issued or updated on the website for new riskometer.
## Risk rate assumed to be 6.40% (FBIL Overnight MIBOR rate as on 31st May 2023).**TotalTotal Expense Ratio includes applicable B30 fee and GST.
*For Fund Manager experience, please refer 'Our Fund Managers'
For last three IDCW, please refer 'Dividend History'.
For scheme performance, please refer 'Scheme Performances'