An open-ended equity scheme following contrarian investment strategy
An open-ended equity scheme following contrarian investment strategy
 |
 |
 
|
|
|
|
is not yet recognised by the market. At times, the broad market takes time to appreciate the long-term potential of some fundamentally sound companies.
Stocks of such companies are traded at prices below their intrinsic value and are regarded as undervalued stocks.
We believe that, over a period of time, the price of a stock reflects the intrinsic value of the underlying company. Thus, the moving up of the price of the undervalued stock towards its intrinsic value will help us generate capital appreciation for investors. However, there can be no assurance that the investment objective of the Scheme will be achieved.
| Issuer/Instrument | Industry/ Rating |
% to Net Assets |
|---|---|---|
| Equity & Equity related | ||
| Banks | 24.65 | |
| ICICI Bank Ltd. | 7.42 | |
| HDFC Bank Ltd. | 4.57 | |
| State Bank Of India | 4.29 | |
| Axis Bank Ltd. | 3.33 | |
| Federal Bank Ltd. | 1.97 | |
| AU Small Finance Bank Ltd. | 1.76 | |
| IndusInd Bank Ltd. | 0.87 | |
| Kotak Mahindra Bank Ltd. | 0.44 | |
| Software | 12.83 | |
| Infosys Ltd. | 6.65 | |
| Tata Consultancy Services Ltd. | 2.93 | |
| Persistent Systems Limited | 1.99 | |
| HCL Technologies Ltd. | 1.26 | |
| Petroleum Products | 9.00 | |
| Reliance Industries Ltd. | 6.91 | |
| Hindustan Petroleum Corporation Ltd | 1.33 | |
| Bharat Petroleum Corporation Ltd. | 0.76 | |
| Pharmaceuticals | 6.39 | |
| Sun Pharmaceuticals Industries Ltd. | 2.43 | |
| Alkem Laboratories Ltd. | 1.27 | |
| Torrent Pharmaceuticals Ltd. | 1.09 | |
| Dr Reddys Laboratories Ltd. | 0.61 | |
| Cipla Ltd. | 0.60 | |
| Zydus Lifesciences Limited | 0.39 | |
| Industrial Products | 5.61 | |
| Cummins India Ltd. | 2.12 | |
| Supreme Industries Limited | 1.95 | |
| Bharat Forge Ltd. | 1.54 | |
| Consumer Non Durables | 5.33 | |
| ITC Ltd. | 1.48 | |
| United Breweries Ltd. | 1.26 | |
| Emami Ltd. | 0.82 | |
| Hindustan Unilever Ltd. | 0.74 | |
| Ruchi Soya Industries Ltd. | 0.59 | |
| Godrej Consumer Products Ltd. | 0.44 | |
| Cement & Cement Products | 4.34 | |
| Ultratech Cement Ltd. | 2.72 | |
| Shree Cement Ltd. | 1.28 | |
| The Ramco Cements Ltd | 0.34 | |
| Auto | 3.89 | |
| Maruti Suzuki India Limited | 2.11 | |
| Mahindra & Mahindra Ltd. | 1.78 | |
| Construction Project | 3.46 | |
| Larsen And Toubro Ltd. | 3.46 | |
| Telecom - Services | 3.13 | |
| Bharti Airtel Ltd | 3.02 | |
| Bharti Airtel Ltd - Partly Paid Shares | 0.11 | |
| Consumer Durables | 2.80 | |
| Voltas Ltd. | 1.32 | |
| Kajaria Ceramics Ltd. | 0.97 | |
| Bata India Ltd. | 0.51 | |
| Ferrous Metals | 2.27 | |
| Jindal Steel & Power Ltd. | 1.82 | |
| Tata Steel Ltd. | 0.45 | |
| Chemicals | 2.00 | |
| SRF Ltd. | 2 | |
| Power | 1.43 | |
| National Thermal Power Corporation Limited | 1.43 | |
| Aerospace & Defense | 1.40 | |
| Bharat Electronics Ltd. | 1.40 | |
| Insurance | 1.21 | |
| SBI Life Insurance Company Ltd | 1.21 | |
| Auto Ancillaries | 1.18 | |
| Motherson Sumi Systems Ltd. | 0.90 | |
| Motherson Sumi Wiring India Limited | 0.28 | |
| Construction | 1.15 | |
| Oberoi Realty Ltd | 1.15 | |
| Finance | 1.09 | |
| Aavas Financiers Ltd. | 0.72 | |
| SBI Cards & Payment Services Pvt. Ltd. | 0.37 | |
| Transportation | 1.02 | |
| Inter Globe Aviation Ltd | 1.02 | |
| Gas | 0.96 | |
| Gujarat State Petronet Ltd. | 0.96 | |
| Fertilisers | 0.69 | |
| Coromandel International Ltd. | 0.69 | |
| Oil | 0.55 | |
| Oil & Natural Gas Corporation Ltd. | 0.55 | |
| Leisure Services | 0.45 | |
| Jubilant Foodworks Limited | 0.45 | |
| Financial Technology (Fintech) | 0.29 | |
| PB Fintech Ltd. | 0.29 | |
| Retailing | 0.27 | |
| Medplus Health Services Ltd. | 0.27 | |
| Minerals/Mining | 0.25 | |
| NMDC Ltd. | 0.25 | |
| Equity & Equity related - Total | 97.64 | |
| Triparty Repo | 2.71 | |
| Net Current Assets/(Liabilities) | -0.35 | |
| Grand Total | 100.00 | |
| | ||
| Monthly SIP of (₹) 10000 | Since Inception | 10 years | 7 years | 5 years | 3 years | 1 year |
| Total amount invested (Rs) | 20,10,000 | 12,00,000 | 8,40,000 | 6,00,000 | 3,60,000 | 1,20,000 |
| Total Value as on Mar 31, 2022 (Rs) | 70,15,641 | 26,73,374 | 14,85,001 | 9,24,476 | 5,06,411 | 1,26,888 |
| Scheme Returns (%) | 13.53 | 15.31 | 16.00 | 17.34 | 23.52 | 10.90 |
| Nifty 500 (TRI) Returns (%) | 13.35 | 15.35 | 16.03 | 17.71 | 25.12 | 12.85 |
| Alpha* | 0.18 | -0.04 | -0.03 | -0.37 | -1.59 | -1.95 |
| Nifty 500 (TRI) (Rs)# | 68,92,409 | 26,79,394 | 14,86,411 | 9,32,811 | 5,17,569 | 1,28,099 |
| Nifty 100 (TRI) Returns (%) | 13.36 | 14.84 | 15.59 | 17.04 | 23.01 | 12.77 |
| Alpha* | 0.18 | 0.47 | 0.41 | 0.30 | 0.51 | -1.88 |
| Nifty 100 (TRI) (Rs)# | 68,94,754 | 26,07,378 | 14,63,521 | 9,17,633 | 5,02,904 | 1,28,053 |
| Nifty 50 (TRI) (Rs)^ | 66,75,607 | 25,87,090 | 14,75,961 | 9,26,652 | 5,03,582 | 1,28,365 |
| Nifty 50 (TRI) Returns (%) | 13.03 | 14.70 | 15.83 | 17.44 | 23.11 | 13.28 |
TRI - Total Return Index, In terms of SEBI circular dated January 4, 2018, the performance of the scheme is benchmarked to the Total Return variant (TRI) of the Benchmark Index instead of Price Return Variant (PRI). Alpha is difference of scheme return with benchmark return.
*All payouts during the period have been reinvested in the units of the scheme at the then prevailing NAV. Returns >= 1 year: CAGR (Compounded Annualised Growth Rate). N.A stands for data not available. Note: Point to Point (PTP) Returns in INR shows the value of 10,000/- investment made at inception. Source: ICRA MFI Explorer.
| Reg-Plan-IDCW | Rs28.5140 |
| Dir-Plan-IDCW | Rs33.2050 |
| Growth option | Rs82.7210 |
| Direct Growth option | Rs93.3140 |
A) Regular Plan B) Direct Plan
Options: Payout of IDCW, Reinvestment of
IDCW & Growth (applicable for all plans)
| Fund Manager | Ms. Shibani Kurian* |
| Benchmark | Nifty 500 TRI (Tier 1) Nifty 100 TRI (Tier 2) |
| Allotment date | July 27, 2005 |
| AAUM | Rs1,200.55 crs |
| AUM | Rs1,255.46 crs |
| Folio count | 56,207 |
Trustee's Discretion
| Portfolio Turnover | 19.52% |
| $Beta | 0.99 |
| $Sharpe ## | 0.63 |
| $Standard Deviation | 21.89% |
| (P/E) | 26.14 |
| P/BV | 3.36 |
| IDCW Yield | 1.12 |
Initial Investment: Rs5000 and in multiple of
Rs1 for purchase and for Rs0.01 for switches
Additional Investment: Rs1000 & in multiples
of Rs1
Ideal Investments Horizon: 5 years & above
Entry Load: Nil. (applicable for all plans)
Exit Load:
a) For redemption / switch out of upto 10%
of the initial investment amount (limit)
purchased or switched in within 1 year from
the date of allotment: Nil.
b) If units redeemed or switched out are in
excess of the limit within 1 year from the
date of allotment: 1%
c) If units are redeemed or switched out on
or after 1 year from the date of allotment:
NIL
Regular: 2.32%; Direct: 0.92%
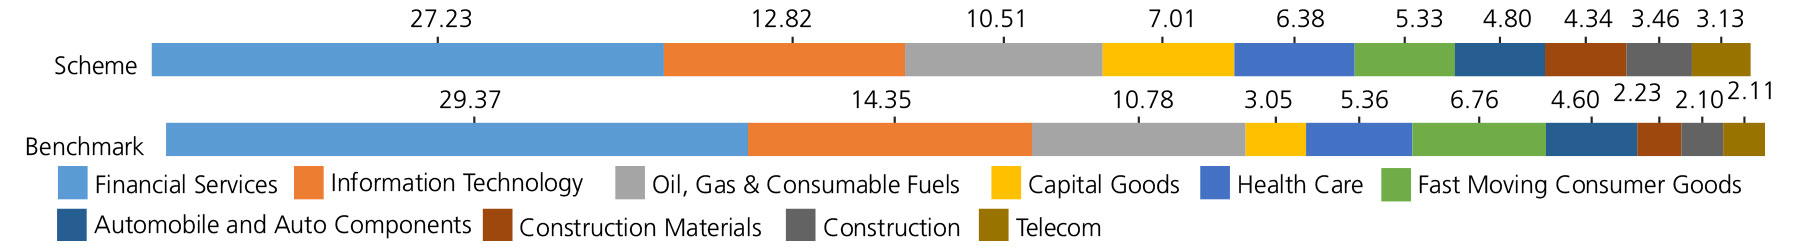
Benchmark
Benchmark
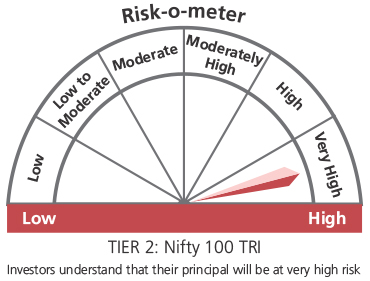
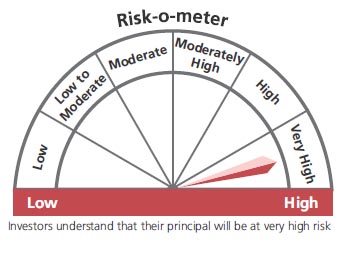
This product is suitable for investors who are seeking*:
- Long term capital growth
- Investment in portfolio of predominantly equity & equity related securities.
* Investors should consult their financial advisers if in doubt about whether the product is suitable for them.
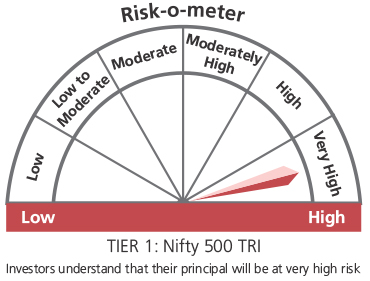
***As per SEBI Circular dated 27th October 2021 The first tier benchmark is reflective of the category of the scheme and the second tier benchmark is demonstrative of the investment style / strategy of the Fund Manager within the category.
## Risk rate assumed to be 3.90% (FBIL Overnight MIBOR rate as on 31st March 2022).**Total Expense Ratio includes applicable B30 fee and GST.
* For Fund Manager experience, please refer 'Our Fund Managers'
For last three IDCW, please refer 'Dividend History'.
For scheme performance, please refer 'Scheme Performances'