| KOTAK ELSS TAX SAVER FUND
An Open-Ended Equity Linked Saving Scheme with a statutory lock in of 3 years and tax benefits
An Open-Ended Equity Linked Saving Scheme with a statutory lock in of 3 years and tax benefits
| KOTAK ELSS TAX SAVER FUND
An Open-Ended Equity Linked Saving Scheme with a statutory lock in of 3 years and tax benefits
An Open-Ended Equity Linked Saving Scheme with a statutory lock in of 3 years and tax benefits
 |
 |
 
|
|
|
|
Investment Objective
The investment objective of the scheme is to generate long-term capital appreciation from a diversified portfolio of
equity and equity related securities and enable investors to avail the income tax rebate, as permitted from time to time. However, there is no
assurance that the objective of the scheme will be achieved.
| Issuer/Instrument | |
% to Net Assets |
|---|---|---|
| Equity & Equity related | ||
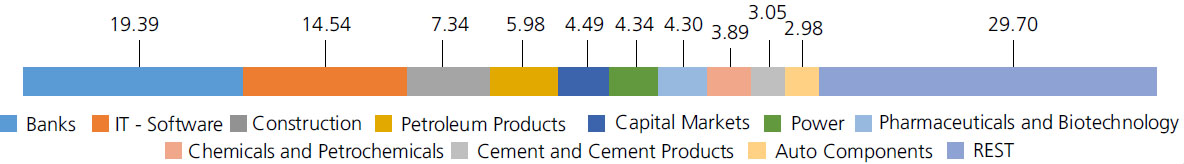
| Banks | 19.39 | |
| HDFC Bank Ltd. | 8.65 | |
| State Bank Of India | 3.54 | |
| Axis Bank Ltd. | 3.01 | |
| ICICI Bank Ltd. | 1.47 | |
| Kotak Mahindra Bank Ltd. | 1.45 | |
| Bank Of Baroda | 1.27 | |
| IT - Software | 14.54 | |
| Infosys Ltd. | 5.74 | |
| Tech Mahindra Ltd. | 3.84 | |
| Mphasis Ltd | 2.19 | |
| Birlasoft Ltd. | 1.45 | |
| Wipro Ltd. | 1.32 | |
| Construction | 7.34 | |
| Larsen And Toubro Ltd. | 3.33 | |
| KALPATARU PROJECTS INTERNATIONAL LIMITED | 1.57 | |
| KNR Constructions Ltd. | 1.51 | |
| Ashoka Buildcon Limited | 0.66 | |
| G R Infraprojects Limited | 0.27 | |
| Petroleum Products | 5.98 | |
| HINDUSTAN PETROLEUM CORPORATION LTD | 2.28 | |
| RELIANCE INDUSTRIES LTD. | 1.93 | |
| Bharat Petroleum Corporation Ltd. | 1.77 | |
| Capital Markets | 4.49 | |
| ICICI Securities Ltd | 4.00 | |
| NUVAMA WEALTH MANAGEMENT LIMITED | 0.49 | |
| Power | 4.34 | |
| NTPC LTD | 2.75 | |
| Power Grid Corporation Of India Ltd. | 1.59 | |
| Pharmaceuticals and Biotechnology | 4.30 | |
| Sun Pharmaceuticals Industries Ltd. | 2.22 | |
| Cipla Ltd. | 1.13 | |
| Zydus Lifesciences Limited | 0.95 | |
| Chemicals and Petrochemicals | 3.89 | |
| Linde India Ltd. | 2.13 | |
| SOLAR INDUSTRIES INDIA LIMITED | 1.04 | |
| SRF Ltd. | 0.72 | |
| Cement and Cement Products | 3.05 | |
| Ultratech Cement Ltd. | 1.66 | |
| Ambuja Cements Ltd. | 1.39 | |
| Auto Components | 2.98 | |
| Bosch Ltd. | 2.54 | |
| JK TYRE & INDUSTRIES LTD. | 0.44 | |
| Telecom - Services | 2.95 | |
| Bharti Airtel Ltd | 2.39 | |
| BHARTI HEXACOM LTD. | 0.49 | |
| Bharti Airtel Ltd - Partly Paid Shares | 0.07 | |
| Automobiles | 2.85 | |
| Hero MotoCorp Ltd. | 1.84 | |
| Mahindra & Mahindra Ltd. | 1.01 | |
| Gas | 2.59 | |
| GAIL (India) Ltd. | 1.80 | |
| Gujarat State Petronet Ltd. | 0.79 | |
| Finance | 2.48 | |
| CRISIL Ltd. | 1.48 | |
| Bajaj Finance Ltd. | 1.00 | |
| Diversified FMCG | 2.20 | |
| Hindustan Unilever Ltd. | 2.20 | |
| Industrial Manufacturing | 2.11 | |
| KAYNES TECHNOLOGY INDIA LTD. | 1.22 | |
| DEE DEVELOPMENT ENGINEEERS LTD | 0.89 | |
| Retailing | 2.11 | |
| ZOMATO LTD. | 1.72 | |
| SWIGGY LTD | 0.39 | |
| Consumer Durables | 1.92 | |
| Voltas Ltd. | 1.07 | |
| PG ELECTROPLAST LTD | 0.58 | |
| Hawkins Cooker Ltd | 0.27 | |
| Fertilizers and Agrochemicals | 1.77 | |
| Coromandel International Ltd. | 1.77 | |
| Personal Products | 1.71 | |
| Dabur India Ltd. | 1.71 | |
| Ferrous Metals | 1.34 | |
| Jindal Steel & Power Ltd. | 1.34 | |
| Aerospace and Defense | 1.22 | |
| Data Patterns (India) Ltd. | 1.22 | |
| Beverages | 1.03 | |
| UNITED SPIRITS LTD. | 1.03 | |
| Electrical Equipment | 0.85 | |
| ABB India Ltd | 0.85 | |
| Entertainment | 0.84 | |
| Sun TV Network Ltd. | 0.84 | |
| Industrial Products | 0.84 | |
| Carborundum Universal Ltd. | 0.84 | |
| Textiles and Apparels | 0.49 | |
| Garware Technical Fibres Ltd. | 0.49 | |
| Equity & Equity related - Total | 99.60 | |
| Triparty Repo | 1.51 | |
| Net Current Assets/(Liabilities) | -1.11 | |
| Grand Total | 100.00 | |
| Monthly SIP of (₹) 10000 | Since Inception | 10 years | 7 years | 5 years | 3 years | 1 year |
| Total amount invested (₹) | 23,10,000 | 12,00,000 | 8,40,000 | 6,00,000 | 3,60,000 | 1,20,000 |
| Total Value as on Jan 31, 2025 (₹) | 1,04,12,499 | 27,35,586 | 15,70,595 | 9,58,581 | 4,56,013 | 1,16,542 |
| Scheme Returns (%) | 13.88 | 15.72 | 17.54 | 18.78 | 15.94 | -5.28 |
| Nifty 500 (TRI) Returns (%) | 13.69 | 15.55 | 17.14 | 18.78 | 16.21 | -3.04 |
| Alpha* | 0.19 | 0.17 | 0.40 | 0.01 | -0.28 | -2.25 |
| Nifty 500 (TRI) (₹)# | 1,01,86,104 | 27,10,396 | 15,48,152 | 9,58,460 | 4,57,805 | 1,18,021 |
| Nifty 50 (TRI) (₹)^ | 92,09,546 | 25,27,121 | 14,40,370 | 8,96,726 | 4,39,534 | 1,20,014 |
| Nifty 50 (TRI) Returns (%) | 12.83 | 14.24 | 15.12 | 16.06 | 13.37 | 0.02 |
Scheme Inception : - November 23, 2005. The returns are calculated by XIRR approach assuming investment of ₹ 10,000/- on the 1st working day of ` every month. XIRR helps in calculating return on investments given an initial and final value and a series of cash inflows and outflows and taking the time of investment into consideration. Since inception returns are assumed to be starting from the beginning of the subsequent month from the date of inception. The SIP performance details provided herein are of Regular Plan - Growth Option Different plans have different expense structure. # Benchmark; ^ Additional Benchmark. TRI – Total Return Index, In terms of para 6.14 of SEBI Master circular No. SEBI/HO/IMD/IMD-PoD-1/P/CIR/2024/90 dated June 27, 2024, the performance of the scheme is benchmarked to the Total Return variant (TRI) of the Benchmark Index instead of Price Return Variant (PRI). Alpha is difference of scheme return with benchmark return. *All payouts during the period have been reinvested in the units of the scheme at the then prevailing NAV. Source: ICRA MFI Explorer
Net Asset Value (NAV)
| Regular | Direct | |
| Growth | Rs108.4687 | Rs126.4014 |
| IDCW | Rs40.5940 | Rs52.9488 |
Available Plans/Options
A) Regular Plan B) Direct Plan
Options: Growth and IDCW (Payout)
(applicable for all plans)
| Fund Manager* | Mr. Harsha Upadhyaya |
| Benchmark | Nifty 500 TRI |
| Allotment date | November 23, 2005 |
| AAUM | Rs 5,994.67 crs |
| AUM | Rs 5,892.76 crs |
| Folio count | 5,18,907 |
IDCW Frequency
Trustee's Discretion
Ratios
| Portfolio Turnover | 30.50% |
| $Beta | 0.90 |
| $Sharpe ## | 0.61 |
| $Standard Deviation | 13.07% |
| ^^(P/E) | 19.68 |
| ^^P/BV | 3.43 |
Minimum Investment Amount
Initial & Additional Investment
• Rs500 and in multiples of Rs500
Systematic Investment Plan (SIP)
• Rs500 and in multiples of Rs500
Ideal Investments Horizon
• 5 years & above
Load Structure
Entry Load: Nil. (applicable for all plans)
Exit Load: Nil. (applicable for all plans)
Total Expense Ratio**
| Regular Plan: | 1.77% |
| Direct Plan: | 0.67% |
Data as on 31st January, 2025 unless
otherwise specified.
Folio Count data as on 31st December 2024.
Folio Count data as on 31st December 2024.
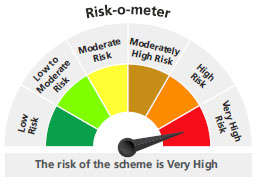
Fund
Benchmark : Nifty 500 TRI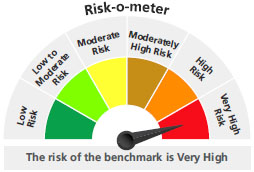
This product is suitable for investors who are seeking*:
Benchmark : Nifty 500 TRI
This product is suitable for investors who are seeking*:
- long term capital growth with a 3 year lock in
- Investment in portfolio of predominantly equity & equity related securities.
* Investors should consult their financial advisors if in doubt about whether the product is suitable for them.
The above risk-o—meter is based on the scheme portfolio as on 31st December, 2024. An addendum may be issued or updated on the website for new riskometer.
## Risk rate assumed to be 6.65% (FBIL Overnight MIBOR rate as on 31st Jan 2024).**Total Expense Ratio includes applicable B30 fee and GST.
* For Fund Manager experience, please refer 'For Regular Plan' & 'For Direct Plan'
For last three IDCW, please refer 'Dividend History'.
For scheme performance, please refer 'For Regular Plan' & 'For Direct Plan'