| KOTAK NIFTY 50 ETF
An open ended scheme replicating/ tracking Nifty 50 index
NSE Symbol - NIFTY1
BSE Scrip Code - 537708
An open ended scheme replicating/ tracking Nifty 50 index
NSE Symbol - NIFTY1
BSE Scrip Code - 537708
| KOTAK NIFTY 50 ETF
An open ended scheme replicating/ tracking Nifty 50 index
NSE Symbol - NIFTY1
BSE Scrip Code - 537708
An open ended scheme replicating/ tracking Nifty 50 index
NSE Symbol - NIFTY1
BSE Scrip Code - 537708
 
|
|
|
Investment Objective
The investment objective of the scheme is to provide returns before expenses that closely correspond to the total
returns of the Nifty 50 subject to tracking errors. However, there is no assurance or guarantee that the investment objective of the scheme will
be achieved.
The investment objective of the scheme is to provide returns before expenses that closely correspond to the total
returns of the Nifty 50 subject to tracking errors. However, there is no assurance or guarantee that the investment objective of the scheme will
be achieved.
| Issuer/Instrument | |
% to Net Assets |
|---|---|---|
| Equity & Equity Related |
||
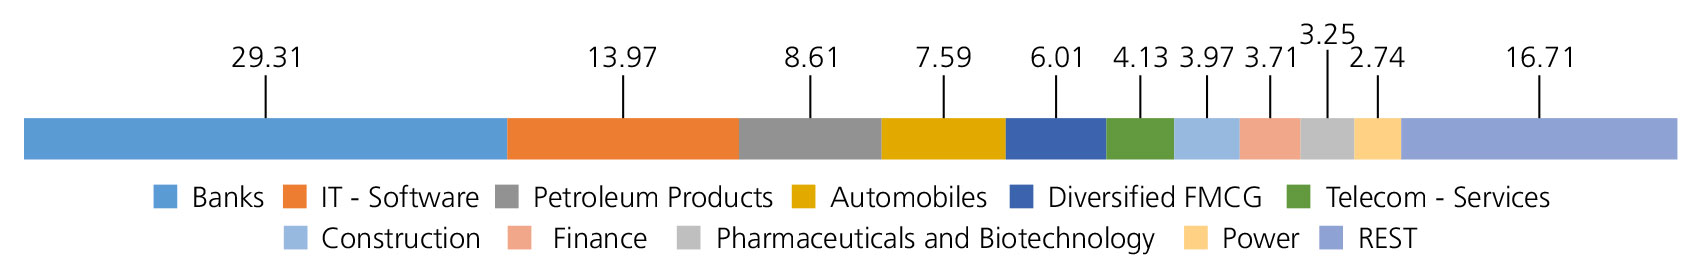
| Banks | 29.31 | |
| HDFC Bank Ltd. | 12.22 | |
| ICICI Bank Ltd. | 8.36 | |
| State Bank Of India | 2.81 | |
| Axis Bank Ltd. | 2.66 | |
| Kotak Mahindra Bank Ltd. | 2.64 | |
| IndusInd Bank Ltd. | 0.62 | |
| IT - Software | 13.97 | |
| Infosys Ltd. | 6.41 | |
| Tata Consultancy Services Ltd. | 3.98 | |
| HCL Technologies Ltd. | 1.73 | |
| Tech Mahindra Ltd. | 1.01 | |
| Wipro Ltd. | 0.84 | |
| Petroleum Products | 8.61 | |
| RELIANCE INDUSTRIES LTD. | 8.13 | |
| Bharat Petroleum Corporation Ltd. | 0.48 | |
| Automobiles | 7.59 | |
| Mahindra & Mahindra Ltd. | 2.50 | |
| Maruti Suzuki India Limited | 1.53 | |
| Tata Motors Ltd. | 1.42 | |
| Bajaj Auto Ltd. | 0.93 | |
| Eicher Motors Ltd. | 0.68 | |
| Hero MotoCorp Ltd. | 0.53 | |
| Diversified FMCG | 6.01 | |
| ITC Ltd. | 3.94 | |
| Hindustan Unilever Ltd. | 2.07 | |
| Telecom - Services | 4.13 | |
| Bharti Airtel Ltd | 4.13 | |
| Construction | 3.97 | |
| Larsen And Toubro Ltd. | 3.97 | |
| Finance | 3.71 | |
| Bajaj Finance Ltd. | 2.09 | |
| Bajaj Finserv Ltd. | 0.90 | |
| SHRIRAM FINANCE LTD. | 0.72 | |
| Pharmaceuticals and Biotechnology | 3.25 | |
| Sun Pharmaceuticals Industries Ltd. | 1.78 | |
| Cipla Ltd. | 0.77 | |
| DR REDDYS LABORATORIES LTD. | 0.70 | |
| Power | 2.74 | |
| NTPC LTD | 1.45 | |
| Power Grid Corporation Of India Ltd. | 1.29 | |
| Consumer Durables | 2.35 | |
| Titan Company Ltd. | 1.37 | |
| Asian Paints Ltd. | 0.98 | |
| Cement and Cement Products | 2.12 | |
| Ultratech Cement Ltd. | 1.24 | |
| Grasim Industries Ltd. | 0.88 | |
| Ferrous Metals | 1.92 | |
| Tata Steel Ltd. | 1.06 | |
| JSW Steel Ltd. | 0.86 | |
| Food Products | 1.35 | |
| NESTLE INDIA LTD. | 0.78 | |
| Britannia Industries Ltd. | 0.57 | |
| Insurance | 1.28 | |
| HDFC Life Insurance Company Ltd. | 0.65 | |
| SBI Life Insurance Company Ltd | 0.63 | |
| Retailing | 1.21 | |
| Trent Ltd | 1.21 | |
| Aerospace and Defense | 0.99 | |
| Bharat Electronics Ltd. | 0.99 | |
| Oil | 0.96 | |
| Oil & Natural Gas Corporation Ltd. | 0.96 | |
| Consumable Fuels | 0.85 | |
| Coal India Ltd. | 0.85 | |
| Non - Ferrous Metals | 0.82 | |
| Hindalco Industries Ltd | 0.82 | |
| Transport Infrastructure | 0.77 | |
| Adani Port and Special Economic Zone Ltd. | 0.77 | |
| Healthcare Services | 0.65 | |
| Apollo Hospitals Enterprises Ltd. | 0.65 | |
| Agricultural Food and other Product | 0.63 | |
| Tata Consumer Products Ltd | 0.63 | |
| Metals and Minerals Trading | 0.54 | |
| Adani Enterprises Ltd. | 0.54 | |
| Leisure Services | 0.14 | |
| ITC HOTELS LIMITED | 0.14 | |
| Equity & Equity Related - Total | 99.87 | |
| Triparty Repo | 0.01 | |
| Net Current Assets/(Liabilities) | 0.12 | |
| Grand Total | 100.00 | |
Net Asset Value (NAV)
| Rs255.9738 |
Available Plans/Options
The Scheme does not offer any Plans/Options for investment.
| Fund Manager* | Mr. Devender Singhal & Mr. Satish Dondapati |
| Benchmark | Nifty 50 TRI |
| Allotment date | February 2, 2010 |
| AAUM | Rs2,636.00 crs |
| AUM | Rs2,688.42 crs |
| Folio count | 32,560 |
Ratios
| Portfolio Turnover | 32.36% |
| Tracking Error: | 0.03% |
Minimum Investment Amount
Through Exchange:1 Unit,
Through AMC: 12500 Units and in
multiple thereof.
Greater than Rs. 25 Crore- For Large
Investors***
Ideal Investments Horizon
• 5 years & above
Load Structure
Entry Load:
Nil.
Exit Load:
Nil
Total Expense Ratio**
| 0.04% |
Data as on 31st January, 2025 unless otherwise specified.
Folio Count data as on 31st December 2024.
Folio Count data as on 31st December 2024.
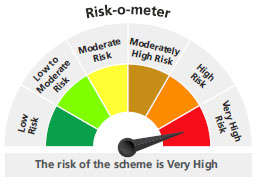
Fund
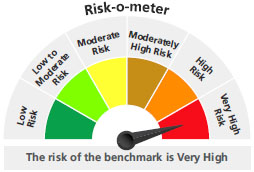
Benchmark : Nifty 50 TRI
This product is suitable for investors who are seeking*:
- Long term capital growth
- Investment in stocks comprising the underlying index and endeavours to track the benchmark index, subject to tracking errors.
* Investors should consult their financial advisors if in doubt about whether the product is suitable for them.
The above risk-o—meter is based on the scheme portfolio as on 31st December, 2024. An addendum may be issued or updated on the website for new riskometer.
***Not applicable to Recognised Provident Funds, approved gratuity funds and approved superannuation funds under Income Tax Act, 1961, Schemes managed by Employee Provident Fund Organisation of India and Market Makers as per para 3.6.2.1 and 3.6.2.2 of SEBI Master Circular no. SEBI/HO/IMD/IMD-PoD-1/P/CIR/2024/90 dated June 27, 2024 as amended from time to time along with SEBI letter no. SEBI/HO/IMD- POD-2/P/OW/2024/15311/1 dated April 26, 2024 and SEBI letter no. SEBI/HO/IMD- POD-2/P/OW/2024/34080/1 dated October 29, 2024.
**Total Expense Ratio includes applicable B30 fee and GST.
* For Fund Manager experience, please refer 'For Regular Plan' & 'For Direct Plan'
For last three IDCW, please refer 'Dividend History'.
For scheme performance, please refer 'For Regular Plan' & 'For Direct Plan'