An open ended equity scheme investing in maximum 30 stocks in large-cap, mid-cap and small-cap category
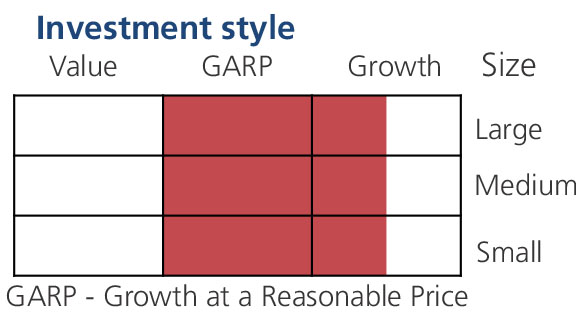
An open ended equity scheme investing in maximum 30 stocks in large-cap, mid-cap and small-cap category
 |
 |
 
|
|
|
|
The investment objective of the scheme is to generate long term capital appreciation/income by investing in equity & equity related instruments across market capitalization of up to 30 companies. However, there is no assurance that the objective of the scheme will be achieved.
The investment objective of the scheme is to generate long term capital appreciation/income by investing in equity & equity related instruments across market capitalization of up to 30 companies. However, there is no assurance that the objective of the scheme will be achieved.
| Issuer/Instrument | |
% to Net Assets |
|
|---|---|---|---|
| Equity & Equity related
|
|||
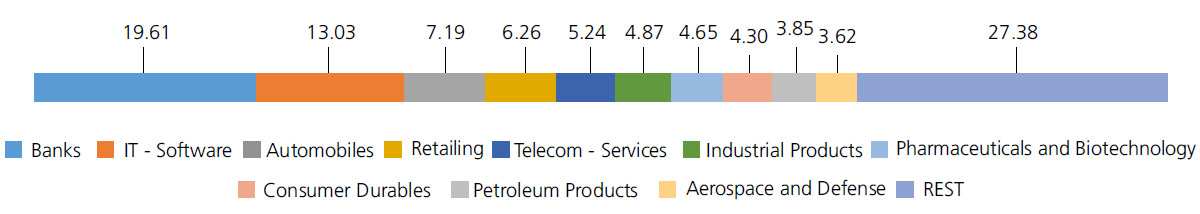
| Banks | 19.61 | ||
| ICICI Bank Ltd. | 6.84 | ||
| HDFC Bank Ltd. | 5.51 | ||
| State Bank Of India | 4.24 | ||
| Axis Bank Ltd. | 3.02 | ||
| IT - Software | 13.03 | ||
| Infosys Ltd. | 5.40 | ||
| Tech Mahindra Ltd. | 5.16 | ||
| Birlasoft Ltd. | 2.47 | ||
| Automobiles | 7.19 | ||
| Maruti Suzuki India Limited | 3.81 | ||
| Hero MotoCorp Ltd. | 3.38 | ||
| Retailing | 6.26 | ||
| ZOMATO LTD. | 3.91 | ||
| FSN E-COMMERCE VENTURES LTD. | 2.35 | ||
| Telecom - Services | 5.24 | ||
| Bharti Airtel Ltd | 5.24 | ||
| Industrial Products | 4.87 | ||
| KEI INDUSTRIES LTD. | 2.94 | ||
| Carborundum Universal Ltd. | 1.93 | ||
| Pharmaceuticals and Biotechnology | 4.65 | ||
| Sun Pharmaceuticals Industries Ltd. | 4.65 | ||
| Consumer Durables | 4.30 | ||
| BLUE STAR LTD. | 2.45 | ||
| Kajaria Ceramics Ltd. | 1.85 | ||
| Petroleum Products | 3.85 | ||
| RELIANCE INDUSTRIES LTD. | 3.85 | ||
| Aerospace and Defense | 3.62 | ||
| Bharat Electronics Ltd. | 3.62 | ||
| Power | 3.32 | ||
| NTPC LTD | 3.32 | ||
| Cement and Cement Products | 3.19 | ||
| Ultratech Cement Ltd. | 3.19 | ||
| Finance | 2.96 | ||
| SHRIRAM FINANCE LTD. | 2.96 | ||
| Gas | 2.94 | ||
| GAIL (India) Ltd. | 2.94 | ||
| Construction | 2.55 | ||
| Larsen And Toubro Ltd. | 2.55 | ||
| Healthcare Services | 2.55 | ||
| Fortis Healthcare India Ltd | 2.55 | ||
| Transport Services | 2.47 | ||
| Inter Globe Aviation Ltd | 2.47 | ||
| Personal Products | 2.32 | ||
| Godrej Consumer Products Ltd. | 2.32 | ||
| Capital Markets | 2.00 | ||
| NUVAMA WEALTH MANAGEMENT LIMITED | 2.00 | ||
| Chemicals and Petrochemicals | 1.80 | ||
| SRF Ltd. | 1.80 | ||
| Equity & Equity related - Total | 98.72 | ||
| Triparty Repo | 1.51 | ||
| Net Current Assets/(Liabilities) | -0.23 | ||
| Grand Total | 100.00 | ||
| | |||
| Monthly SIP of (Rs) 10000 | Since Inception | 5 years | 3 years | 1 year |
| Total amount invested (₹) | 6,70,000 | 6,00,000 | 3,60,000 | 1,20,000 |
| Total Value as on Jan 31, 2025 (₹) | 10,64,488 | 9,08,941 | 4,45,410 | 1,17,880 |
| Scheme Returns (%) | 16.50 | 16.61 | 14.30 | -3.25 |
| Nifty 500 TRI (%) | 18.60 | 18.78 | 16.21 | -3.04 |
| Alpha* | -2.10 | -2.17 | -1.92 | -0.21 |
| Nifty 500 TRI (₹)# | 11,28,189 | 9,58,460 | 4,57,805 | 1,18,021 |
| Nifty 200 (TRI) Returns (%) | 17.69 | 17.89 | 15.47 | -2.24 |
| Alpha* | -1.19 | -1.27 | -1.18 | -1.01 |
| Nifty 200 (TRI) (₹)# | 11,00,230 | 9,37,759 | 4,52,991 | 1,18,543 |
| Nifty 50 (TRI) (₹)^ | 10,48,313 | 8,96,726 | 4,39,534 | 1,20,014 |
| Nifty 50 (TRI) Returns (%) | 15.95 | 16.06 | 13.37 | 0.02 |
| Regular | Direct | |
| Growth | Rs23.0292 | Rs25.1548 |
| IDCW | Rs23.0293 | Rs25.1559 |
A) Regular Plan B) Direct Plan
Options: Payout of IDCW, Reinvestment of
IDCW & Growth (applicable for all plans)
| Fund Manager* | Ms. Shibani Sircar Kurian |
| Benchmark*** | Nifty 500 TRI (Tier 1), Nifty 200 TRI (Tier 2) |
| Allotment date | July 16, 2019 |
| AAUM | Rs3,364.44 crs |
| AUM | Rs3,348.54 crs |
| Folio count | 1,05,700 |
Trustee's Discretion
| Portfolio Turnover | 38.13% |
| $Beta | 0.92 |
| $Sharpe ## | 0.39 |
| $Standard Deviation | 13.02% |
| (P/E) | 26.97 |
| P/BV | 4.17 |
Initial & Additional Investment
• Rs100 and any amount thereafter
Systematic Investment Plan (SIP)
• Rs 100 and any amount thereafter
• 5 years & above
Entry Load: Nil. (applicable for all plans)
Exit Load:
• For redemption / switch out of upto 10%
of the initial investment amount (limit)
purchased or switched in within 1 year from
the date of allotment: Nil.
• If units redeemed or switched out are in
excess of the limit within 1 year from the
date of allotment: 1%
• If units are redeemed or switched out on
or after 1 year from the date of allotment:
NIL.
| Regular Plan: | 1.90% |
| Direct Plan: | 0.56% |
Folio Count data as on 31st December 2024.
Benchmark - Tier 1 : Nifty 500 TRI
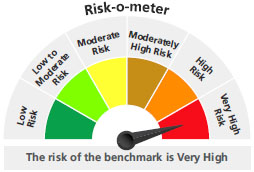
Benchmark - Tier 2 : Nifty 100 TRI
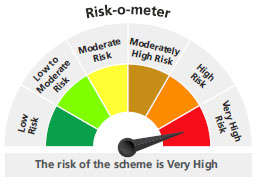
This product is suitable for investors who are seeking*:
- Long term capital growth
- market capitalisation in maximum 30 stocks Investment in equity & equity related securities across
* Investors should consult their financial advisors if in doubt about whether the product is suitable for them.
The above risk-o—meter is based on the scheme portfolio as on 31st December, 2024. An addendum may be issued or updated on the website for new riskometer.
## Risk rate assumed to be 6.65% (FBIL Overnight MIBOR rate as on 31st Jan 2024). **Total Expense Ratio includes applicable B30 fee and GST.
* For Fund Manager experience, please refer 'For Regular Plan' & 'For Direct Plan'
For scheme performance, please refer 'For Regular Plan' & 'For Direct Plan'