An open ended scheme investing in arbitrage opportunities
An open ended scheme investing in arbitrage opportunities
 |
 |
 
|
|
|
|
The investment objective of the scheme is to generate capital appreciation and income by predominantly investing in arbitrage opportunities in the cash and derivatives segment of the equity market, and by investing the balance in debt and money market instruments. However, there is no assurance that the objective of the scheme will be achieved.
The investment objective of the scheme is to generate capital appreciation and income by predominantly investing in arbitrage opportunities in the cash and derivatives segment of the equity market, and by investing the balance in debt and money market instruments. However, there is no assurance that the objective of the scheme will be achieved.
| Issuer/ Instrument |
Industry/ Rating |
% to Net Assets |
% to Net Assets Derivatives |
|---|---|---|---|
| Equity & Equity related | |||
| RELIANCE INDUSTRIES LTD. | Petroleum Products | 5.80 | -5.82 |
| Axis Bank Ltd. | Banks | 4.04 | -4.06 |
| ICICI Bank Ltd. | Banks | 3.44 | -3.46 |
| HDFC Bank Ltd. | Banks | 2.61 | -2.62 |
| State Bank Of India | Banks | 2.12 | -2.13 |
| Bharti Airtel Ltd | Telecom - Services | 1.65 | -1.66 |
| Tata Consultancy Services Ltd. | IT - Software | 1.46 | -1.47 |
| Tata Steel Ltd. | Ferrous Metals | 1.24 | -1.24 |
| ITC Ltd. | Diversified FMCG | 1.19 | -1.18 |
| NTPC LTD | Power | 1.17 | -1.18 |
| Others | 48.42 | -48.63 | |
| Equity & Equity related - Total | 73.14 | -73.45 | |
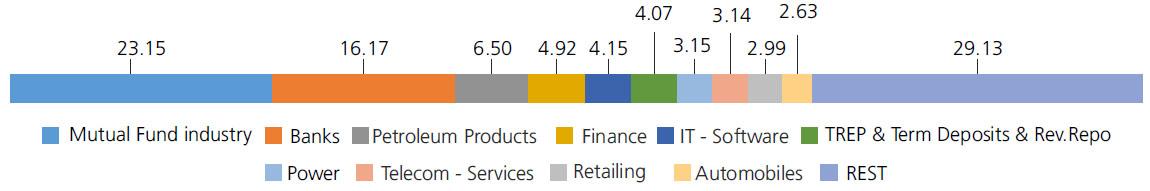
| Mutual Fund Units | 23.15 | ||
| Money Market Instruments | |||
| Commercial Paper(CP)/Certificate of Deposits(CD) | 0.94 | ||
| Triparty Repo | 4.07 | ||
| Net Current Assets/(Liabilities) | -1.30 | ||
| Grand Total | 100.00 | ||
| | |||
For detailed portfolio log on to
https://www.kotakmf.com/Products/funds/hybrid-funds/Kotak-Equity-Arbitrage-Fund/Dir-G
Mutual Fund Units as provided above is towards margin for derivatives transactions
Equity Derivative Exposuer is 73.45%
| Monthly SIP of (₹) 10000 | Since Inception | 10 years | 7 years | 5 years | 3 years | 1 year |
| Total amount invested (₹) | 23,30,000 | 12,00,000 | 8,40,000 | 6,00,000 | 3,60,000 | 1,20,000 |
| Total Value as on January 31, 2025 (₹) | 46,33,194 | 16,27,831 | 10,41,177 | 7,05,607 | 4,02,362 | 1,24,783 |
| Scheme Returns (%) | 6.60 | 5.94 | 6.04 | 6.41 | 7.35 | 7.45 |
| Nifty 50 Arbitrage Index (%) | NA | 5.61 | 5.91 | 6.43 | 7.46 | 7.70 |
| Alpha* | NA | 0.33 | 0.13 | -0.02 | -0.12 | -0.25 |
| Nifty 50 Arbitrage Index (₹)# | NA | 16,00,259 | 10,36,393 | 7,05,918 | 4,03,075 | 1,24,942 |
| NIFTY 1 Year T-Bill Index (₹)^ | 46,03,252 | 16,39,509 | 10,35,502 | 6,96,252 | 3,98,188 | 1,24,412 |
| NIFTY 1 Year T-Bill Index (%) | 6.54 | 6.08 | 5.88 | 5.88 | 6.65 | 6.87 |
| Regular | Direct | |
| Growth | Rs36.4610 | Rs38.8639 |
| Monthly IDCW | Rs10.7248 | Rs11.2073 |
A) Regular Plan B) Direct Plan
Options: Payout of IDCW, Reinvestment of IDCW & Growth (applicable for all plans)
| Fund Manager* | Mr. Hiten Shah |
| Benchmark | Nifty 50 Arbitrage |
| Allotment date | September 29, 2005 |
| AAUM | Rs56,469.11 crs |
| AUM | Rs57,567.02 crs |
| Folio count | 82,472 |
Monthly (Monday preceding the last Thursday of the month)
| Average Maturity | 0.08 yrs |
| Modified Duration | 0.08 yrs |
| Macaulay Duration | 0.08 yrs |
| Annualised YTM* | 6.83% |
| $Standard Deviation | 0.62% |
| $Beta | 0.75 |
| $Sharpe## | -0.30 |
| ^^P/E$$ | 20.41 |
| ^^P/BV$$ | 2.88 |
| Portfolio Turnover | 2,089.66% |
$$Equity Component of the Portfolio.
Initial & Additional Investment
• Rs100 and any amount thereafter
Systematic Investment Plan (SIP)
• Rs 100 and any amount thereafter
• 3 months & above
Entry Load: Nil. (applicable for all plans)
Exit Load:
• For redemptions/switch outs (including
SIP/STP) within 30 days from the date of
allotment of units: 0.25%
• For redemptions/switch outs (including
SIP/STP) after 30 days from the date of
allotment of units: Nil
| Regular Plan: | 1.04% |
| Direct Plan: | 0.43% |
Folio Count data as on 31st December 2024.
Fund
Benchmark: Nifty 50 Arbitrage
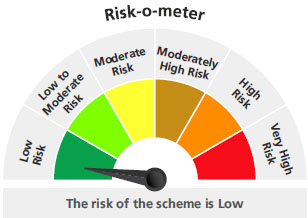
This product is suitable for investors who are seeking*:
- Income from arbitrage opportunities in the equity market
- Investment in arbitrage opportunities in the cash & derivatives segment of the equity market.
* Investors should consult their financial advisors if in doubt about whether the product is suitable for them.
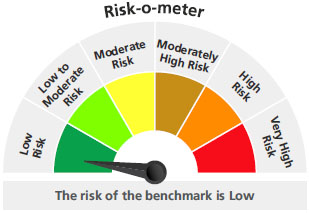
The above risk-o—meter is based on the scheme portfolio as on 31st December, 2024. An addendum may be issued or updated on the website for new riskometer.
## Risk rate assumed to be 6.65% (FBIL Overnight MIBOR rate as on 31st Jan 2024).**Total Expense Ratio includes applicable B30 fee and GST.
* For Fund Manager experience, please refer 'For Regular Plan' & 'For Direct Plan'
For last three IDCW, please refer 'Dividend History'.
For scheme performance, please refer 'For Regular Plan' & 'For Direct Plan'