Large cap fund - An open-ended equity scheme predominantly investing in large cap stocks
Large cap fund - An open-ended equity scheme predominantly investing in large cap stocks
 |
 |
 
|
|
|
|
| Issuer/Instrument | |
% to Net Assets |
|---|---|---|
| Equity & Equity related |
||
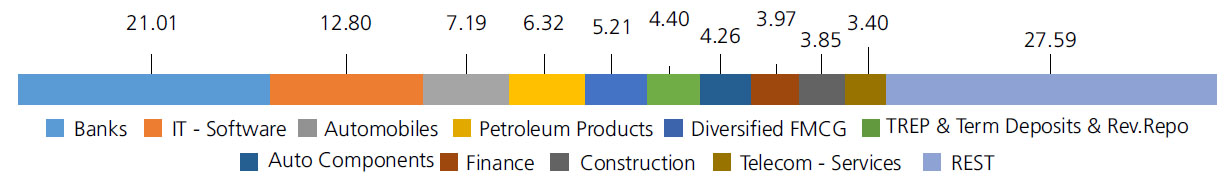
| Banks | 21.01 | |
| HDFC Bank Ltd. | 6.87 | |
| ICICI Bank Ltd. | 6.18 | |
| State Bank Of India | 2.89 | |
| Axis Bank Ltd. | 2.81 | |
| Kotak Mahindra Bank Ltd. | 1.67 | |
| IndusInd Bank Ltd. | 0.59 | |
| IT - Software | 12.80 | |
| Infosys Ltd. | 5.45 | |
| Tata Consultancy Services Ltd. | 2.53 | |
| Tech Mahindra Ltd. | 1.63 | |
| HCL Technologies Ltd. | 1.18 | |
| PERSISTENT SYSTEMS LIMITED | 0.81 | |
| Mphasis Ltd | 0.64 | |
| LTIMindtree Limited | 0.56 | |
| Automobiles | 7.19 | |
| Mahindra & Mahindra Ltd. | 3.50 | |
| Maruti Suzuki India Limited | 2.48 | |
| Hero MotoCorp Ltd. | 0.85 | |
| HYUNDAI MOTORS INDIA LTD | 0.36 | |
| Petroleum Products | 6.32 | |
| RELIANCE INDUSTRIES LTD. | 5.20 | |
| Bharat Petroleum Corporation Ltd. | 1.12 | |
| Diversified FMCG | 5.21 | |
| ITC Ltd. | 3.06 | |
| Hindustan Unilever Ltd. | 2.15 | |
| Auto Components | 4.26 | |
| Apollo Tyres Ltd. | 0.97 | |
| Bharat Forge Ltd. | 0.81 | |
| SAMVARDHANA MOTHERSON INTERNATIONAL LIMITED | 0.80 | |
| Bosch Ltd. | 0.68 | |
| Schaeffler India Ltd | 0.59 | |
| Balkrishna Industries Ltd. | 0.41 | |
| Finance | 3.97 | |
| Bajaj Finance Ltd. | 1.62 | |
| SHRIRAM FINANCE LTD. | 1.04 | |
| Power Finance Corporation Ltd. | 0.76 | |
| POONAWALLA FINCORP LTD. | 0.55 | |
| Construction | 3.85 | |
| Larsen And Toubro Ltd. | 3.85 | |
| Telecom - Services | 3.40 | |
| Bharti Airtel Ltd | 3.28 | |
| Bharti Airtel Ltd - Partly Paid Shares | 0.12 | |
| Retailing | 3.39 | |
| ZOMATO LTD. | 1.29 | |
| BRAINBEES SOLUTIONS LIMITED | 0.66 | |
| SWIGGY LTD | 0.56 | |
| AVENUE SUPERMARTS LTD. | 0.51 | |
| VISHAL MEGA MART LIMITED | 0.37 | |
| Pharmaceuticals and Biotechnology | 3.27 | |
| Sun Pharmaceuticals Industries Ltd. | 2.30 | |
| Zydus Lifesciences Limited | 0.97 | |
| Power | 3.22 | |
| NTPC LTD | 2.46 | |
| NTPC GREEN ENERGY LIMITED | 0.76 | |
| Cement and Cement Products | 2.26 | |
| Ultratech Cement Ltd. | 2.26 | |
| Transport Services | 1.87 | |
| Inter Globe Aviation Ltd | 1.87 | |
| Fertilizers and Agrochemicals | 1.54 | |
| Coromandel International Ltd. | 1.54 | |
| Beverages | 1.46 | |
| UNITED SPIRITS LTD. | 1.46 | |
| Chemicals and Petrochemicals | 1.21 | |
| SOLAR INDUSTRIES INDIA LIMITED | 1.21 | |
| Ferrous Metals | 1.20 | |
| Tata Steel Ltd. | 1.20 | |
| Personal Products | 1.20 | |
| Godrej Consumer Products Ltd. | 1.20 | |
| Realty | 1.07 | |
| Oberoi Realty Ltd | 0.78 | |
| Mahindra Lifespace Developers Ltd | 0.29 | |
| Industrial Products | 0.87 | |
| Cummins India Ltd. | 0.87 | |
| Consumer Durables | 0.81 | |
| V-Guard Industries Ltd. | 0.81 | |
| Aerospace and Defense | 0.79 | |
| HINDUSTAN AERONAUTICS LTD. | 0.51 | |
| ASTRA MICROWAVE PRODUCTS LTD. | 0.28 | |
| Non - Ferrous Metals | 0.79 | |
| Hindalco Industries Ltd | 0.79 | |
| Gas | 0.76 | |
| Gujarat State Petronet Ltd. | 0.76 | |
| Healthcare Services | 0.59 | |
| Apollo Hospitals Enterprises Ltd. | 0.59 | |
| Insurance | 0.55 | |
| HDFC Life Insurance Company Ltd. | 0.55 | |
| Equity & Equity related - Total | 94.86 | |
| Mutual Fund Units | ||
| Kotak Liquid Direct Growth | 0.80 | |
| Mutual Fund Units - Total | 0.80 | |
| Futures | ||
| CNX NIFTY-FEB2025 | 0.86 | |
| Triparty Repo | 4.40 | |
| Net Current Assets/(Liabilities) | -0.06 | |
| Grand Total | 100.00 | |
| | ||
Term Deposit as provided above is towards margin for derivatives transactions
Note: Large Cap, Midcap, Small cap and Debt and Money Market stocks as a % age of Net Assets: 83.06, 8.34, 4.32 & 4.28.
| Monthly SIP of (₹) 10000 | Since Inception | 10 years | 7 years | 5 years | 3 years | 1 year |
| Total amount invested (₹) | 26,40,000 | 12,00,000 | 8,40,000 | 6,00,000 | 3,60,000 | 1,20,000 |
| Total Value as on Jan 31, 2025 (₹) | 1,76,84,497 | 25,14,391 | 14,71,956 | 9,12,413 | 4,50,106 | 1,19,698 |
| Scheme Returns (%) | 14.93 | 14.15 | 15.73 | 16.77 | 15.03 | -0.47 |
| Nifty 100 (TRI) Returns (%) | 14.42 | 14.29 | 15.25 | 16.37 | 13.94 | -2.31 |
| Alpha* | 0.51 | -0.14 | 0.48 | 0.40 | 1.09 | 1.85 |
| Nifty 100 (TRI) (₹)# | 1,64,73,967 | 25,33,213 | 14,47,195 | 9,03,580 | 4,43,101 | 1,18,492 |
| Nifty 50 (TRI) Returns (%) | 14.03 | 14.24 | 15.12 | 16.06 | 13.37 | 0.02 |
| Alpha* | 0.90 | -0.09 | 0.61 | 0.71 | 1.65 | -0.49 |
| Nifty 50 (TRI) (₹)# | 1,56,21,360 | 25,27,121 | 14,40,370 | 8,96,726 | 4,39,534 | 1,20,014 |
| BSE SENSEX (TRI) (₹)^ | 1,56,75,390 | 25,17,259 | 14,19,283 | 8,79,941 | 4,34,066 | 1,20,202 |
| BSE SENSEX (TRI) Returns (%) | 14.06 | 14.17 | 14.71 | 15.29 | 12.51 | 0.31 |
| Regular | Direct | |
| Growth | Rs532.3286 | Rs609.1420 |
| IDCW | Rs68.7147 | Rs80.5607 |
A) Regular Plan B) Direct Plan
Options: Payout of IDCW, Reinvestment of
IDCW & Growth (applicable for all plans)
| Fund Manager* | Mr. Rohit Tandon |
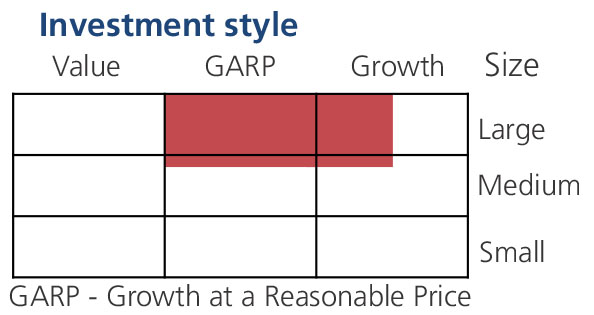
| Benchmark*** | Nifty 100 TRI (Tier 1), Nifty 50 TRI (Tier 2) |
| Allotment date | December 29, 1998 |
| AAUM | Rs 9,242.65 crs |
| AUM | Rs 9,267.66 crs |
| Folio count | 3,98,485 |
Trustee's Discretion
| Portfolio Turnover | 30.40% |
| $Beta | 0.91 |
| $Sharpe ## | 0.49 |
| $Standard Deviation | 12.42% |
| (P/E) | 24.09 |
| P/BV | 3.88 |
Initial & Additional Investment
• Rs100 and any amount thereafter
Systematic Investment Plan (SIP)
• Rs 100 and any amount thereafter
• 5 years & above
Entry Load: Nil. (applicable for all plans)
Exit Load:
• For redemption / switch out of upto 10%
of the initial investment amount (limit)
purchased or switched in within 1 year from
the date of allotment: Nil.
• If units redeemed or switched out are in
excess of the limit within 1 year from the
date of allotment: 1%
• If units are redeemed or switched out on
or after 1 year from the date of allotment:
NIL.
| Regular Plan: | 1.74% |
| Direct Plan: | 0.62% |
Folio Count data as on 31st December 2024.
Benchmark- Tier 1 : Nifty 100 TRI
Benchmark- Tier 2 : Nifty 50 TRI
This product is suitable for investors who are seeking*:
- Long term capital growth
- Investment in portfolio of predominantly equity & equity related securities of large cap companies
* Investors should consult their financial advisors if in doubt about whether the product is suitable for them.
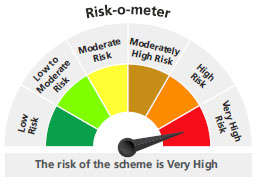
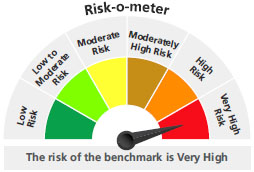
The above risk-o—meter is based on the scheme portfolio as on 31st December, 2024. An addendum may be issued or updated on the website for new riskometer.
***As per para 1.9 of of SEBI Master circular No. SEBI/HO/IMD/IMD-PoD-1/P/CIR/2024/90 dated June 27, 2024 The first tier benchmark is reflective of the category of the scheme and the second tier benchmark is demonstrative of the investment style / strategy of the Fund Manager within the category.
## Risk rate assumed to be 6.65% (FBIL Overnight MIBOR rate as on 31st Jan 2024).**Total Expense Ratio includes applicable B30 fee and GST.
* For Fund Manager experience, please refer 'For Regular Plan' & 'For Direct Plan'
For last three IDCW, please refer 'Dividend History'.
For scheme performance, please refer 'For Regular Plan' & 'For Direct Plan'