Flexicap fund - An open-ended dynamic equity scheme investing across large cap, mid cap, small cap stocks
Flexicap fund - An open-ended dynamic equity scheme investing across large cap, mid cap, small cap stocks
 |
 |
 
|
|
|
|
| Issuer/Instrument | Industry/ Rating |
% to Net Assets |
|---|---|---|
| Equity & Equity related |
||
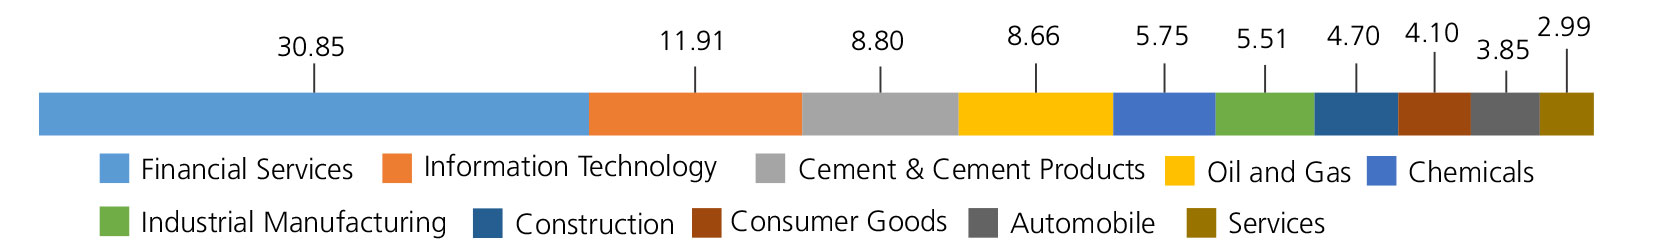
| Banks | 26.69 | |
| ICICI Bank Ltd. | 9.40 | |
| HDFC Bank Ltd. | 5.35 | |
| State Bank Of India | 4.42 | |
| Axis Bank Ltd. | 3.89 | |
| AU Small Finance Bank Ltd. | 2.50 | |
| Kotak Mahindra Bank Ltd. | 1.13 | |
| Software | 11.91 | |
| Infosys Ltd. | 7.36 | |
| Tata Consultancy Services Ltd. | 4.55 | |
| Cement & Cement Products | 8.81 | |
| Ultratech Cement Ltd. | 5.45 | |
| The Ramco Cements Ltd | 1.93 | |
| Shree Cement Ltd. | 1.43 | |
| Petroleum Products | 6.16 | |
| Reliance Industries Ltd. | 5.69 | |
| Bharat Petroleum Corporation Ltd. | 0.47 | |
| Chemicals | 5.75 | |
| SRF Ltd. | 5.10 | |
| Solar Industries India Limited | 0.65 | |
| Construction Project | 4.70 | |
| Larsen And Toubro Ltd. | 4.70 | |
| Consumer Non Durables | 3.07 | |
| Hindustan Unilever Ltd. | 1.48 | |
| United Breweries Ltd. | 1 | |
| Godrej Consumer Products Ltd. | 0.59 | |
| Transportation | 2.99 | |
| Inter Globe Aviation Ltd | 1.66 | |
| Container Corporation of India Ltd. | 1.33 | |
| Aerospace & Defense | 2.78 | |
| Bharat Electronics Ltd. | 2.78 | |
| Pharmaceuticals | 2.72 | |
| Cadila Healthcare Ltd | 1.33 | |
| Cipla Ltd. | 1.03 | |
| Lupin Ltd. | 0.36 | |
| Gas | 2.49 | |
| Petronet LNG Ltd. | 1.61 | |
| Indraprastha Gas Ltd. | 0.88 | |
| Finance | 2.47 | |
| Bajaj Finance Ltd. | 1.58 | |
| SBI Cards & Payment Services Pvt. Ltd. | 0.89 | |
| Ferrous Metals | 2.25 | |
| Jindal Steel & Power Ltd. | 2.25 | |
| Auto Ancillaries | 2.24 | |
| Balkrishna Industries Ltd. | 1.61 | |
| MRF Limited | 0.63 | |
| Industrial Capital Goods | 2.19 | |
| Thermax Ltd. | 1.73 | |
| BEML Ltd. | 0.46 | |
| Insurance | 1.70 | |
| ICICI Lombard General Insurance Company Ltd | 0.91 | |
| Max Financial Services Ltd. | 0.79 | |
| Auto | 1.62 | |
| Mahindra & Mahindra Ltd. | 1.06 | |
| Hero MotoCorp Ltd. | 0.56 | |
| Telecom - Services | 1.57 | |
| Bharti Airtel Ltd | 1.53 | |
| Bharti Airtel Ltd - Partly Paid Shares | 0.04 | |
| Leisure Services | 1.17 | |
| Jubilant Foodworks Limited | 1.17 | |
| Power | 1.08 | |
| Kec International Ltd. | 1.08 | |
| Consumer Durables | 1.02 | |
| Bata India Ltd. | 1.02 | |
| Non - Ferrous Metals | 0.58 | |
| Hindalco Industries Ltd | 0.58 | |
| Industrial Products | 0.54 | |
| AIA Engineering Limited. | 0.54 | |
| Pesticides | 0.31 | |
| Bayer Cropscience Ltd. | 0.31 | |
| Retailing | 0.31 | |
| Zomato Ltd. | 0.31 | |
| Fertilisers | 0.26 | |
| Coromandel International Ltd. | 0.26 | |
| Equity & Equity related - Total | 97.38 | |
| Mutual Fund Units | ||
| Kotak Liquid Scheme Direct Plan Growth | 0.14 | |
| Mutual Fund Units - Total | 0.14 | |
| Debt Instruments | ||
| Debentures and Bonds | ||
| Corporate Debt/Financial Institutions | ||
| Britannia Industries Ltd. ( ) | CRISIL AAA | 0.01 |
| Corporate Debt/Financial Institutions - Total | 0.01 | |
| Triparty Repo | 2.70 | |
| Net Current Assets/(Liabilities) | -0.23 | |
| Grand Total | 100.00 | |
| Monthly SIP of (₹) 10000 | Since Inception | 10 years | 7 years | 5 years | 3 years | 1 year |
| Total amount invested (Rs) | 14,90,000 | 12,00,000 | 8,40,000 | 6,00,000 | 3,60,000 | 1,20,000 |
| Total Value as on Jan 31, 2022 (Rs) | 42,02,775 | 28,22,359 | 14,28,504 | 8,93,154 | 4,96,853 | 1,29,924 |
| Scheme Returns (%) | 15.58 | 16.30 | 14.89 | 15.90 | 22.06 | 15.64 |
| Nifty 500 (TRI) Returns (%) | 14.42 | 15.74 | 16.45 | 18.58 | 26.93 | 20.12 |
| Alpha* | 1.16 | 0.56 | -1.56 | -2.67 | -4.87 | -4.48 |
| Nifty 500 (TRI) (Rs)# | 38,77,781 | 27,38,200 | 15,10,256 | 9,53,567 | 5,31,112 | 1,32,688 |
| Nifty 200 (TRI) Returns (%) | 14.11 | 15.33 | 16.02 | 17.97 | 25.40 | 18.48 |
| Alpha* | 1.47 | 0.98 | -1.12 | -2.07 | -3.34 | -2.83 |
| Nifty 200 (TRI) (Rs)# | 37,95,979 | 26,77,832 | 14,86,987 | 9,39,564 | 5,20,212 | 1,31,675 |
| Nifty 50 (TRI) (Rs)^ | 37,05,936 | 26,17,944 | 14,85,132 | 9,39,897 | 5,11,810 | 1,31,088 |
| Nifty 50 (TRI) Returns (%) | 13.76 | 14.91 | 15.98 | 17.99 | 24.21 | 17.52 |
TRI-- Total Return Index, In terms of SEBI circular dated January 4, 2018, the performance of the scheme is benchmarked to the Total Return variant (TRI) of the Benchmark Index instead of Price Return Variant (PRI).
Alpha is difference of scheme return with benchmark return.
*All payouts during the period have been reinvested in the units of the scheme at the then prevailing NAV. Returns >= 1 year: CAGR (Compounded Annualised Growth Rate). N.A stands for data not available. Note: Point to Point (PTP) Returns in INR shows the value of 10,000/- investment made at inception. Source: ICRA MFI Explorer.
*Alpha is difference of scheme return with benchmark return.
| Reg-Plan-IDCW | Rs31.8060 |
| Dir-Plan-IDCW | Rs35.1420 |
| Growth Option | Rs52.6720 |
| Direct Growth Option | Rs57.5430 |
A) Regular Plan B) Direct Plan
Options: Payout of IDCW, Reinvestment of
IDCW & Growth (applicable for all plans)
| Fund Manager | Mr. Harsha Upadhyaya* |
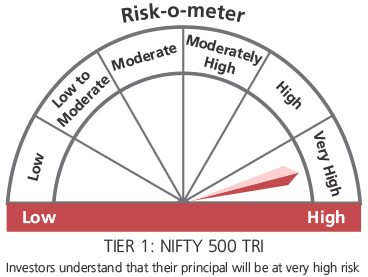
| Benchmark*** | Nifty 500 TRI (Tier 1) Nifty 200 TRI (Tier 2) |
| Allotment date | September 11, 2009 |
| AAUM | Rs38,417.37 crs |
| AUM | Rs37,760.08 crs |
| Folio count | 13,78,690 |
Trustee's Discretion
| Portfolio Turnover | 6.99% |
| $Beta | 0.94 |
| $Sharpe ## | 0.71 |
| $Standard Deviation | 20.86% |
| (P/E) | 33.01 |
| P/BV | 3.96 |
| IDCW Yield | 0.78 |
Initial Investment: Rs
5000 and in multiple of
Rs1 for purchase and for Rs0.01 for switches
Additional Investment: Rs1000 & in
multiples of Rs1
Ideal Investments Horizon: 5 years & above
Entry Load: Nil. (applicable for all plans)
Exit Load:
a) For redemption / switch out of upto 10%
of the initial investment amount (limit)
purchased or switched in within 1 year from
the date of allotment: Nil.
b) If units redeemed or switched out are in
excess of the limit within 1 year from the
date of allotment: 1%
c) If units are redeemed or switched out on
or after 1 year from the date of allotment:
NIL
Regular: 1.59%; Direct: 0.64%
Benchmark
Benchmark
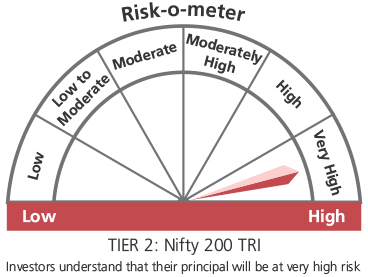
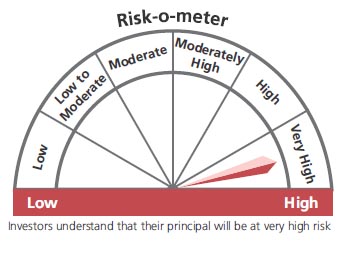
This product is suitable for investors who are seeking*:
- Long term capital growth
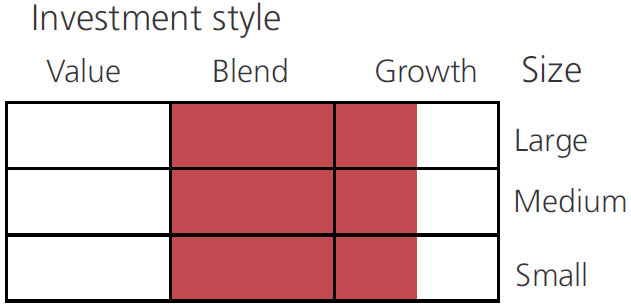
- Investment Portfolio of predominantly equity & equity related securities generally focused on a few selected sectors across market capitalisation.
* Investors should consult their financial advisers if in doubt about whether the product is suitable for them.
***As per SEBI Circular dated 27th October 2021 The first tier benchmark is reflective of the category of the scheme and the second tier benchmark is demonstrative of the investment style / strategy of the Fund Manager within the category.
## Risk rate assumed to be 3.40% (FBIL Overnight MIBOR rate as on 31st January 2022).**Total Expense Ratio includes applicable B30 fee and GST.
* For Fund Manager experience, please refer 'Our Fund Managers'
For last three IDCW, please refer 'Dividend History'.
For scheme performance, please refer 'Scheme Performances'