| KOTAK BOND FUND
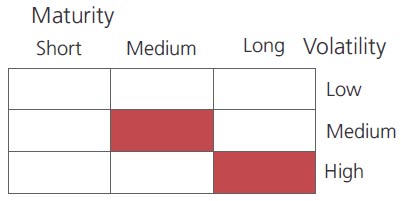
An open ended medium term debt scheme investing in instruments such that the Macaulay duration of the portfolio is between 4 years and 7 years.
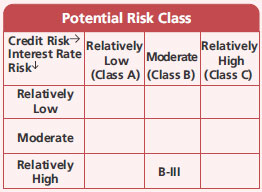
A relatively high interest rate risk and moderate credit risk.
An open ended medium term debt scheme investing in instruments such that the Macaulay duration of the portfolio is between 4 years and 7 years.
A relatively high interest rate risk and moderate credit risk.
| KOTAK BOND FUND
An open ended medium term debt scheme investing in instruments such that the Macaulay duration of the portfolio is between 4 years and 7 years.
A relatively high interest rate risk and moderate credit risk.
An open ended medium term debt scheme investing in instruments such that the Macaulay duration of the portfolio is between 4 years and 7 years.
A relatively high interest rate risk and moderate credit risk.
 |
 |
 
|
|
|
|
Investment Objective
The investment objective of the Scheme is
to create a portfolio of debt instruments
such as bonds, debentures, Government
Securities and money market instruments,
including repos in permitted securities of
different maturities, so as to spread the risk
across different kinds of issuers in the debt
markets. There is no assurance that the
investment objective of the Scheme will be
achieved.
| Issuer/Instrument | Industry/ Rating |
% to Net Assets |
|---|---|---|
| Debt Instruments | ||
| Debentures and Bonds | ||
| Government Dated Securities | ||
| 4.62% Central Government(^) | SOV | 16.96 |
| 6.64% Central Government | SOV | 8.99 |
| 4.04% Central Government(^) | SOV | 7.44 |
| 6.72% State Government-Kerala | SOV | 6.39 |
| 6.10% Central Government | SOV | 5.28 |
| 7.92% State Government-West Bengal | SOV | 3.68 |
| 7.10% State Government-Maharashtra | SOV | 3.59 |
| 6.67% Central Government | SOV | 3.13 |
| 7.84% State Government-Tamil Nadu | SOV | 2.98 |
| 7.23% State Government-Rajasthan | SOV | 2.10 |
| 6.99% Central Government | SOV | 1.96 |
| 7.29% State Government-Kerala | SOV | 1.69 |
| GS CG 22 Feb 2028 - (STRIPS) | SOV | 1.58 |
| 6.45% State Government-Rajasthan | SOV | 1.57 |
| GS CG 22 Feb 2029 - (STRIPS) | SOV | 1.47 |
| 7.18% State Government-Uttarakhand | SOV | 1.47 |
| GS CG 22 Aug 2029 - (STRIPS) | SOV | 1.42 |
| 7.39% State Government-Maharashtra | SOV | 1.27 |
| 7.48% State Government-West Bengal | SOV | 1.24 |
| GS CG 22 Feb 2027 - (STRIPS) | SOV | 1.11 |
| 7.29% State Government-West Bengal | SOV | 1.06 |
| 7.15% State Government-Rajasthan | SOV | 1.05 |
| 4.81% Central Government(^) | SOV | 1.02 |
| GS CG 22 Aug 2028 - (STRIPS) | SOV | 0.99 |
| GS CG 22 Aug 2027 - (STRIPS) | SOV | 0.91 |
| 8.39% State Government-Rajasthan | SOV | 0.87 |
| 7.85% State Government-Rajasthan | SOV | 0.65 |
| 1.44% Central Government | SOV | 0.52 |
| GS CG 23/12/2025 - (STRIPS) | SOV | 0.26 |
| GS CG 22/02/2026 - (STRIPS) | SOV | 0.23 |
| 8.24% State Government-Tamil Nadu | SOV | 0.22 |
| 6.85% State Government-Kerala | SOV | 0.21 |
| 6.58% State Government-Gujarat | SOV | 0.09 |
| GS CG 22 Aug 2022 - (STRIPS) | SOV | 0.07 |
| GS CG 22 Feb 2022 - (STRIPS) | SOV | 0.07 |
| GS CG 22 Aug 2026 - (STRIPS) | SOV | 0.05 |
| GS CG 22 Aug 2031 - (STRIPS) | SOV | 0.04 |
| GS CG 22 Feb 2030 - (STRIPS) | SOV | 0.04 |
| GS CG 22 Aug 2030 - (STRIPS) | SOV | 0.04 |
| GS CG 22 Aug 2032 - (STRIPS) | SOV | 0.03 |
| GS CG 22 Feb 2032 - (STRIPS) | SOV | 0.03 |
| GS CG 22 Aug 2036 - (STRIPS) | SOV | 0.02 |
| GS CG 22 Feb 2036 - (STRIPS) | SOV | 0.02 |
| GS CG 22 Feb 2043 - (STRIPS) | SOV | 0.01 |
| GS CG 22 Feb 2044 - (STRIPS) | SOV | 0.01 |
| GS CG 22 Aug 2043 - (STRIPS) | SOV | 0.01 |
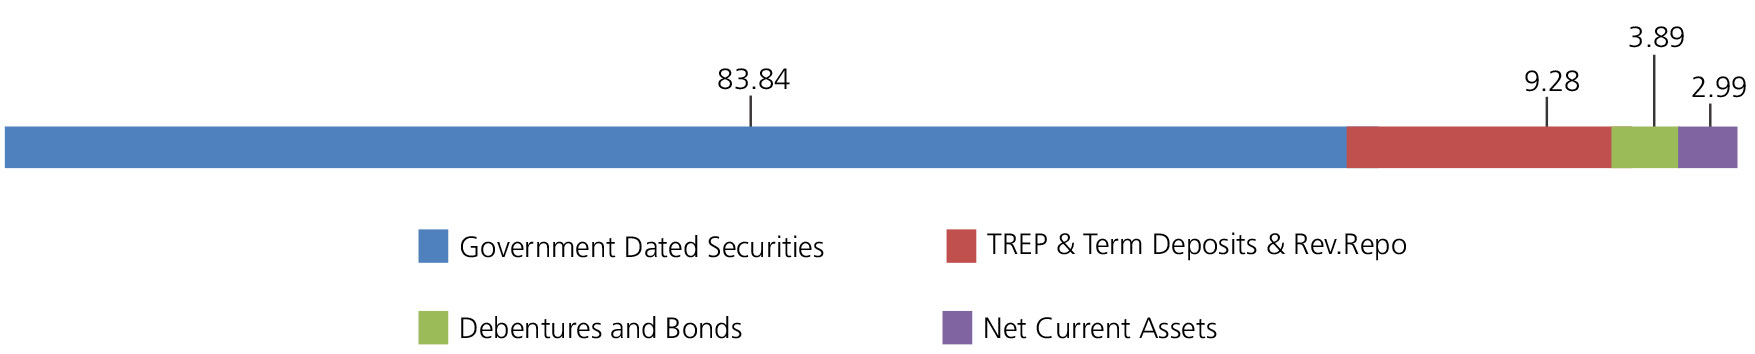
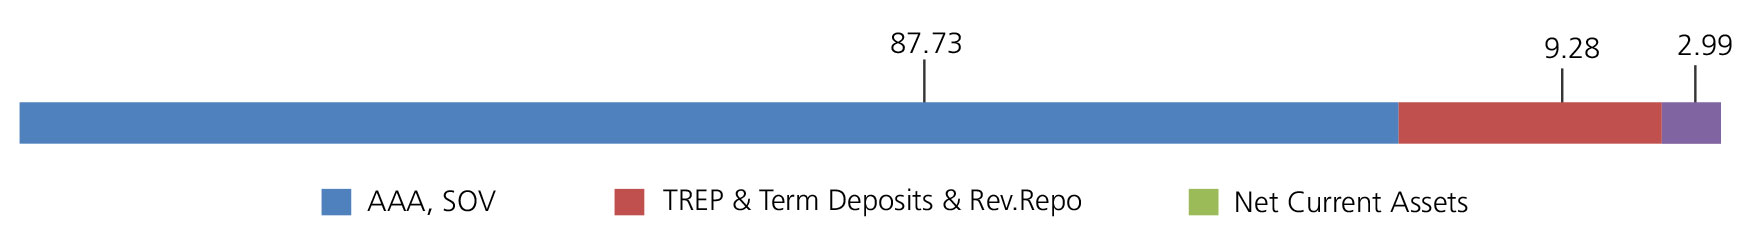
| Government Dated Securities - Total | 83.84 | |
| Public Sector Undertakings | ||
| Power Finance Corporation Ltd. (^) | CRISIL AAA | 3.89 |
| Public Sector Undertakings - Total | 3.89 | |
| Triparty Repo | 9.28 | |
| Net Current Assets/(Liabilities) | 2.99 | |
| Grand Total | 100.00 | |
| Monthly SIP of (₹) 10000 | Since Inception | 10 years | 7 years | 5 years | 3 years | 1 year |
| Total amount invested (Rs) | 26,70,000 | 12,00,000 | 8,40,000 | 6,00,000 | 3,60,000 | 1,20,000 |
| Total Value as on Jan 31, 2022 (Rs) | 70,06,022 | 17,34,283 | 10,67,474 | 7,10,544 | 3,93,944 | 1,22,074 |
| Scheme Returns (%) | 7.89 | 7.15 | 6.74 | 6.69 | 5.93 | 3.21 |
| Nifty Medium to Long Duration Debt Index Returns (%) | NA | 8.10 | 7.74 | 7.67 | 7.00 | 3.90 |
| Alpha | NA | -0.95 | -1.00 | -0.98 | -1.07 | -0.68 |
| Nifty Medium to Long Duration Debt Index (Rs)# | NA | 18,23,005 | 11,06,224 | 7,28,234 | 4,00,294 | 1,22,513 |
| CRISIL 10 Year Gilt Index (Rs)^ | NA | 16,73,751 | 10,33,010 | 6,86,320 | 3,80,617 | 1,19,543 |
| CRISIL 10 Year Gilt Index Returns (%) | NA | 6.47 | 5.82 | 5.31 | 3.65 | -0.70 |
Scheme Inception : - November 25,1999. The returns are calculated by XIRR approach assuming investment of ₹10,000/- on the 1st working day of every month. XIRR helps in calculating return on investments given an initial and final value and a series of cash inflows and outflows and taking the time of investment into consideration. Since inception returns are assumed to be starting from the beginning of the subsequent month from the date of inception. # Benchmark ; ^ Additional Benchmark.
Alpha is difference of scheme return with benchmark return.
Alpha is difference of scheme return with benchmark return.
NAV
| Growth Option | Rs62.5724 |
| Direct Growth Option | Rs67.7213 |
| Quarterly-Reg-Plan-IDCW | Rs13.1762 |
| Quarterly-Dir-Plan-IDCW | Rs18.1254 |
| Annual-Reg-Plan-IDCW | Rs38.3360 |
| Annual-Dir-Plan-IDCW | Rs22.5398 |
| Fund Manager | Mr. Abhishek Bisen* |
| Benchmark | NIFTY Medium to Long Duration Debt Index |
| Allotment date | November 25, 1999 |
| AAUM | Rs2,659.94 crs |
| AUM | Rs2,453.97 crs |
| Folio count | 5,451 |
Available Plans/Options
A) Regular Plan B) Direct Plan
Options: Payout of IDCW, Reinvestment of
IDCW & Growth (applicable for all plans)
IDCW Frequency
At discretion of trustees
Ratios
| Portfolio Average Maturity | 8.14 yrs |
| IRS Average Maturity* | 0.43 yrs |
| Net Average Maturity | 8.57 yrs |
| Portfolio Modified Duration | 3.69 yrs |
| IRS Modified Duration* | 0.40 yrs |
| Net Modified Duration | 4.09 yrs |
| Portfolio Macaulay Duration | 3.81 yrs |
| IRS Macaulay Duration* | 0.41 yrs |
| Net Macaulay Duration | 4.23 yrs |
| YTM | 5.98% |
| $Standard Deviation | 3.40% |
Minimum Investment Amount
Initial Investment: Rs5000 and in multiple
of Rs1 for purchase and for Rs0.01 for
switches
Additional Investment: Rs1000 & in multiples
of Rs1
Ideal Investments Horizon: 2-3 years
Load Structure
Entry Load: Nil. (applicable for all plans)
Exit Load: Nil.(applicable for all plans)
Note: The aforesaid revised exit load
structure will be applicable only on a
prospective basis for Units purchased
/SIP/STP registered on or after April 20,
2021.
Total Expense Ratio**
Regular: 1.70%; Direct: 0.60%
Data as on January 31, 2022
Fund
Benchmark
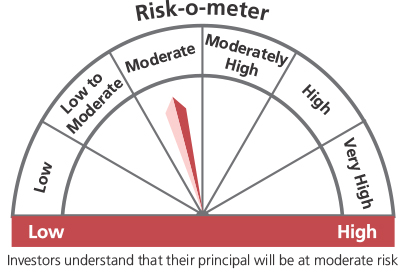
This product is suitable for investors who are seeking*:
- Income over a long investment horizon
- Investment in debt & money market securities with a portfolio Macaulay duration between 4 years & 7 years.
* Investors should consult their financial advisers if in doubt about whether the product is suitable for them.
(^) Fully or Party blocked against Interest Rate Swap (IRS) Hedging Position through Interest Rate Swaps as on 31 Jan 2022 is 23.36% of the net assets.
**Total Expense Ratio includes applicable B30 fee and GST.
* For Fund Manager experience, please refer 'Our Fund Managers'
For last three IDCW, please refer 'Dividend History'.
For scheme performance, please refer 'Scheme Performances'